packcircles and ggplot2
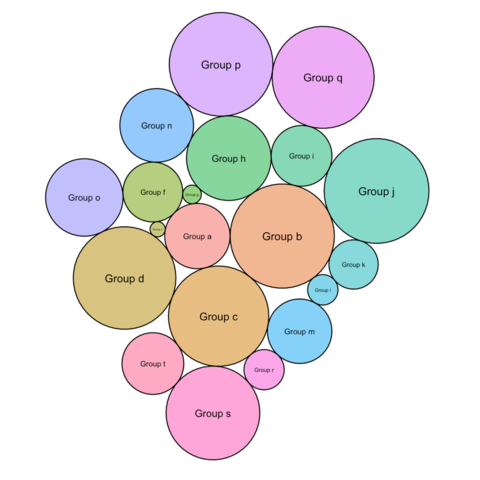
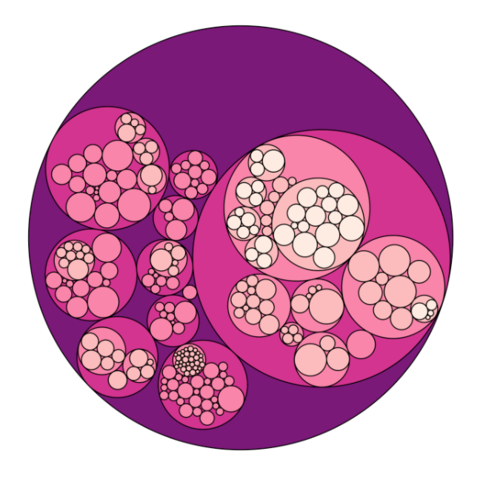
If your dataset has no hierarchy (it is basically just a few entities
with attributed numeric values), the packcircles package
is the best way to build a circular packing chart in R. The packages
basically computes the position of each bubble, allowing to build the
chart with ggplot2.
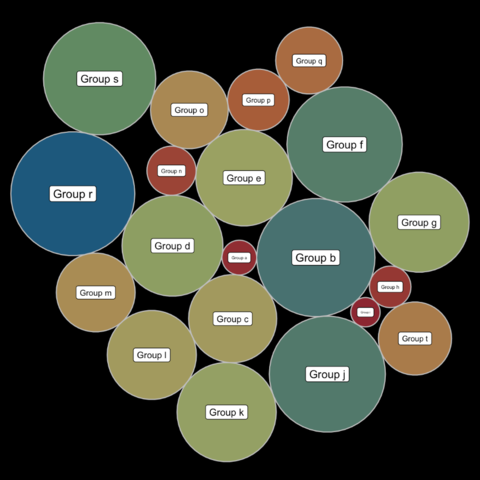
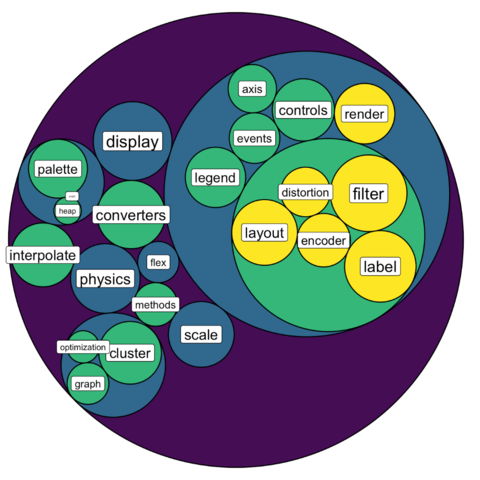
The ggiraph library allows to get an interactive circular
packing with 1 level of hierarchy. This is really handy: hover the
plot and you will get more information concerning each circle.
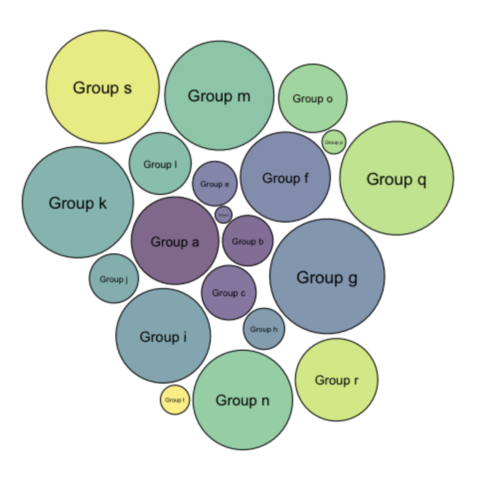
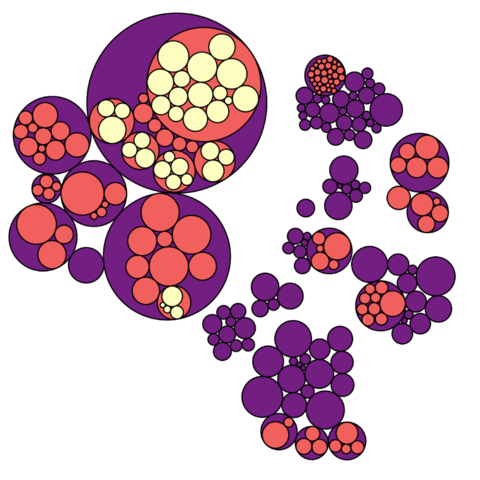
ggraph
If your dataset is a hierarchy, it is time to switch to other tools.
For static versions, the ggraph package is the best
option. It follows the grammar of graphic and makes it a breeze to
customize the appearance following the same logic than
ggplot2.
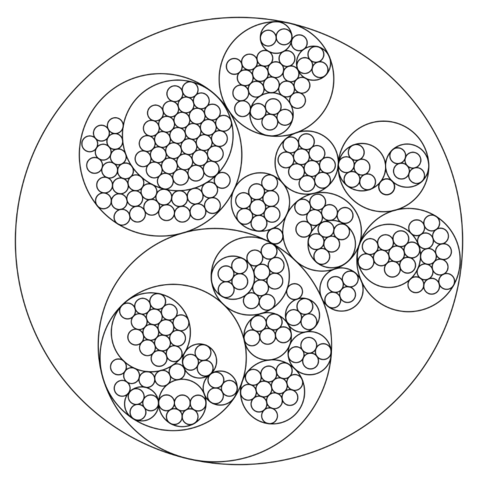
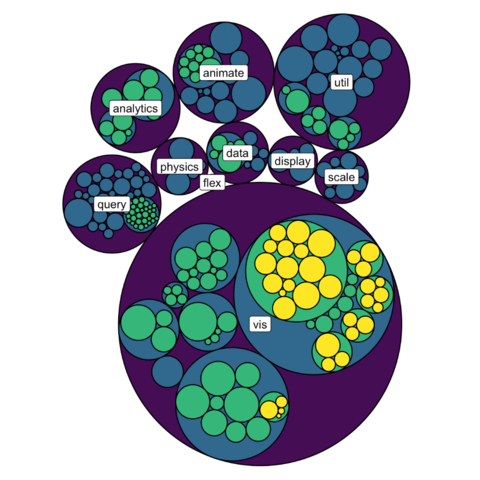
The circlepackeR library allows to get an interactive
circular packing with several levels of hierarchy.
Click on a group to zoom on it. The post describes how to use
the package from different types of input dataset.