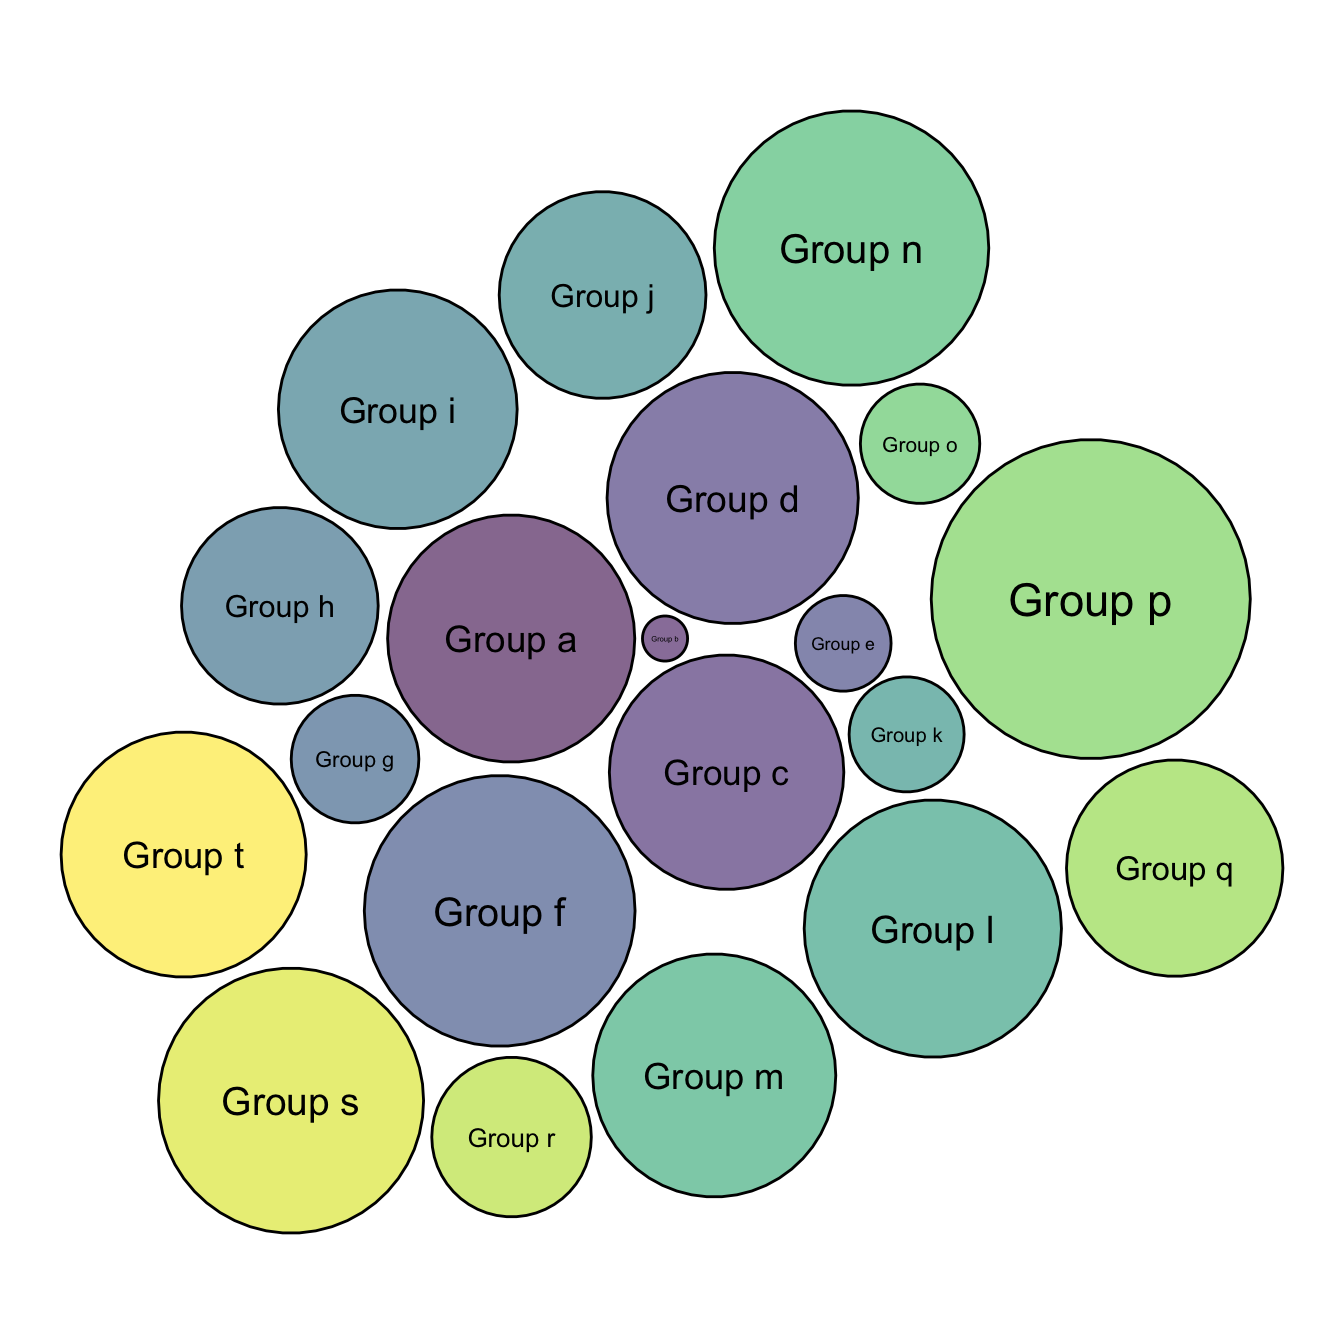
This chart is just a customisation of the chart #305 which describes the basic process to make a one level circle packing chart. I personally like to add a bit of space between each circle.
Basically, all you have to do is to reduce the
radius size in your data once this one has been
calculated. Just multiply it by a number under 0, and it will
decrease the circle size.
If you have been so far, you probably want to check the interactive version of the chart !
# libraries
library(packcircles)
library(ggplot2)
library(viridis)

# Create data
data <- data.frame(group=paste("Group", letters[1:20]), value=sample(seq(1,100),20))

# Generate the layout
packing <- circleProgressiveLayout(data$value, sizetype='area')
packing$radius <- 0.95*packing$radius
data <- cbind(data, packing)
dat.gg <- circleLayoutVertices(packing, npoints=50)

# Plot
ggplot() +
  geom_polygon(data = dat.gg, aes(x, y, group = id, fill=id), colour = "black", alpha = 0.6) +
  scale_fill_viridis() +
  geom_text(data = data, aes(x, y, size=value, label = group), color="black") +
  theme_void() +
  theme(legend.position="none")+
  coord_equal()


