The circlepackeR package allows to build interactive circle packing. Click on a group, and a smooth zoom will reveal the subgroups behind it.
Circle packing is a visualization method for hierarchical data. This kind of data can be stored in 2 main ways:
- Nested data frame
- Edge list
Nested data frame
Edge list
Circular packing fom nested data frame
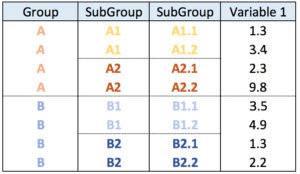
In a nested data frame, each line represents a leaf of the organization. Each column represents a level of the organization.
This data format will require the data.tree library to reformat the input dataset into something readable by circlepackeR.
# Circlepacker package
library(circlepackeR)
# devtools::install_github("jeromefroe/circlepackeR") # If needed

# create a nested data frame giving the info of a nested dataset:
data <- data.frame(
  root=rep("root", 15),
  group=c(rep("group A",5), rep("group B",5), rep("group C",5)),
  subgroup= rep(letters[1:5], each=3),
  subsubgroup=rep(letters[1:3], 5),
  value=sample(seq(1:15), 15)
)

# Change the format. This use the data.tree library. This library needs a column that looks like root/group/subgroup/..., so I build it
library(data.tree)
data$pathString <- paste("world", data$group, data$subgroup, data$subsubgroup, sep = "/")
population <- as.Node(data)

# Make the plot
#circlepackeR(population, size = "value")

# You can custom the minimum and maximum value of the color range.
p <- circlepackeR(population, size = "value", color_min = "hsl(56,80%,80%)", color_max = "hsl(341,30%,40%)")

# save the widget
# library(htmlwidgets)
# saveWidget(p, file=paste0( getwd(), "/HtmlWidget/circular_packing_circlepackeR2.html"))
Circular packing fom edge list
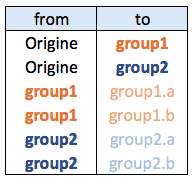
The edge list format has at least 2 columns. It describes all the edges of the data.
This format is widely spread. In this example, we just convert it to a nested data frame before plotting it as seen above.
# Circlepacker package
library(circlepackeR)
# devtools::install_github("jeromefroe/circlepackeR") # If needed

# Let's use the 'flare dataset' (stored in the ggraph library)
library(ggraph)
data_edge <- flare$edges
data_edge$from <- gsub(".*\\.","",data_edge$from)
data_edge$to <- gsub(".*\\.","",data_edge$to)
head(data_edge)   # This is an edge list

# We need to convert it to a nested data frame. the data.tree library is our best friend for that:
library(data.tree)
data_tree <- FromDataFrameNetwork(data_edge)
data_nested <- ToDataFrameTree(data_tree,
                            level1 = function(x) x$path[2],
                            level2 = function(x) x$path[3],
                            level3 = function(x) x$path[4],
                            level4 = function(x) x$path[5])[-1,-1]
data_nested <- na.omit(data_nested)

# Now we can plot it as seen before!
data_nested$pathString <- paste("roots", data_nested$level1, data_nested$level2, data_nested$level3, data_nested$level4, sep = "/")
data_nested$value=1
data_Node <- as.Node(data_nested)
p <- circlepackeR(data_Node, size = "value")
#p

# save the widget
# library(htmlwidgets)
# saveWidget(p, file=paste0( getwd(), "/HtmlWidget/circular_packing_circlepackeR1.html"))