This page aims to describe how to make a basic dendrogram representing hierarchical data with the ggraph library. Two input formats are considered:
- edge list → 2 columns, one row is on connection
- nested data frame → one row is one path from root to leaf. As many columns as the number of levels in the hierarchy
Please visit this page to learn how to custom these dendrograms. If you want to create a dendrogram from clustering result, visit the dendrogram section of the gallery.
Dendrogram from edge list
Edge list is the most convenient format to use ggraph. Follow those steps:
- transform the input dataframe to a graph object using the
graph_from_data_frame()function from theigraphlibrary - use the dendrogram layout of
ggraphwithlayout = 'dendrogram'
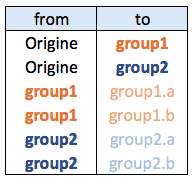
Edge list data format
# libraries
library(ggraph)
library(igraph)
library(tidyverse)
# create an edge list data frame giving the hierarchical structure of your individuals
d1 <- data.frame(from="origin", to=paste("group", seq(1,5), sep=""))
d2 <- data.frame(from=rep(d1$to, each=5), to=paste("subgroup", seq(1,25), sep="_"))
edges <- rbind(d1, d2)
# Create a graph object
mygraph <- graph_from_data_frame( edges )
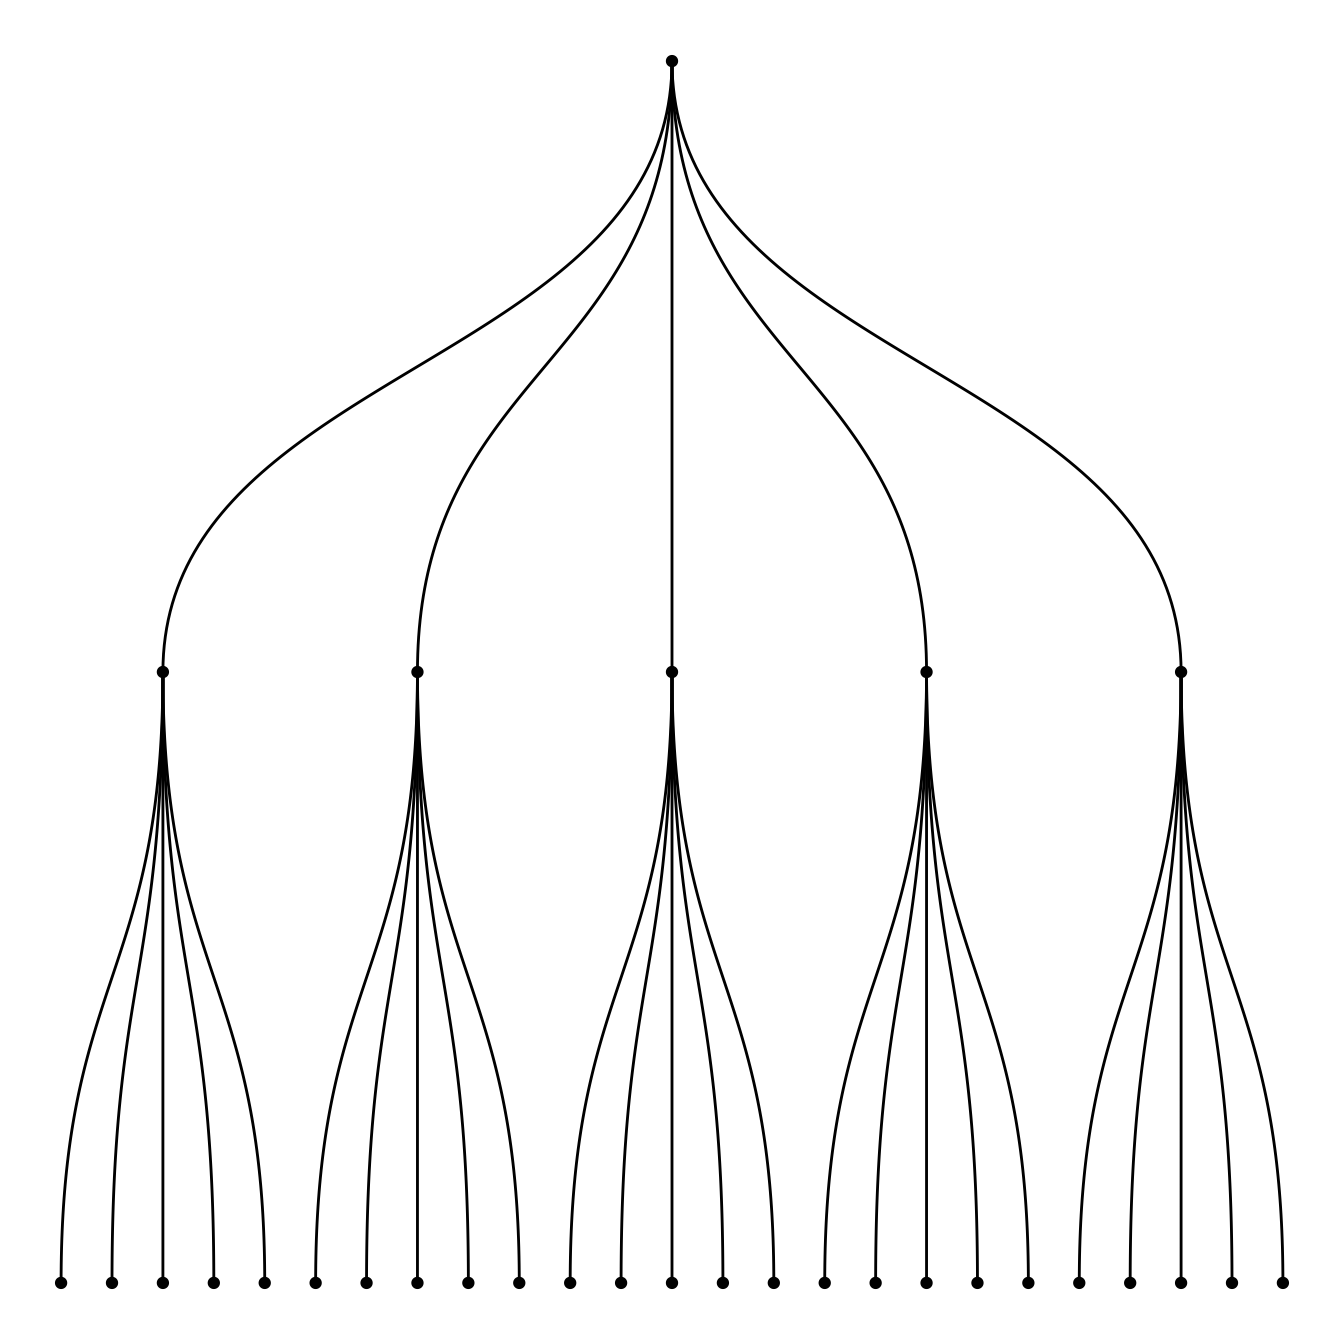
# Basic tree
ggraph(mygraph, layout = 'dendrogram', circular = FALSE) +
geom_edge_diagonal() +
geom_node_point() +
theme_void()Dendrogram from a nested dataframe
Another common format is the nested data frame. The code below shows how to easily transform it into a nested data frame. Once it is done, just apply the code described above once more.
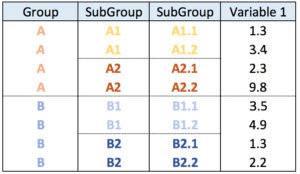
Nested dataframe format
# libraries
library(ggraph)
library(igraph)
library(tidyverse)
# create a data frame
data <- data.frame(
level1="CEO",
level2=c( rep("boss1",4), rep("boss2",4)),
level3=paste0("mister_", letters[1:8])
)
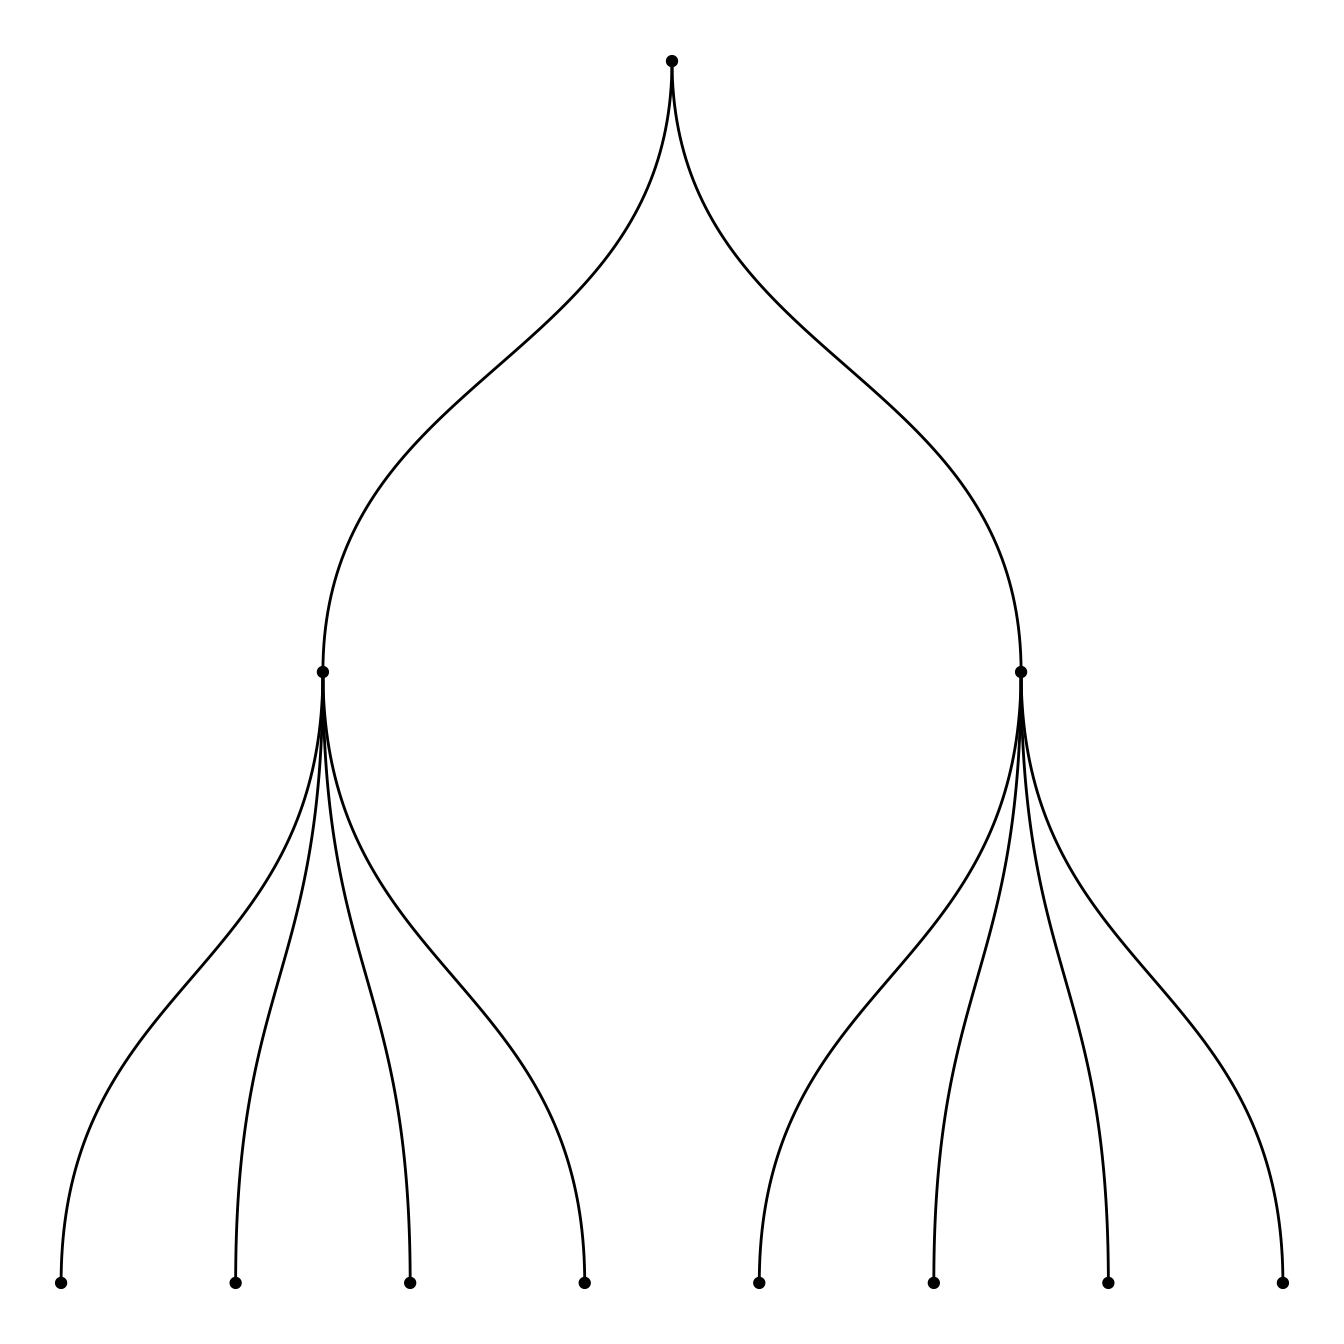
# transform it to a edge list!
edges_level1_2 <- data %>% select(level1, level2) %>% unique %>% rename(from=level1, to=level2)
edges_level2_3 <- data %>% select(level2, level3) %>% unique %>% rename(from=level2, to=level3)
edge_list=rbind(edges_level1_2, edges_level2_3)
# Now we can plot that
mygraph <- graph_from_data_frame( edge_list )
ggraph(mygraph, layout = 'dendrogram', circular = FALSE) +
geom_edge_diagonal() +
geom_node_point() +
theme_void()Related chart types

Grouped and Stacked barplot

Treemap

Doughnut

Pie chart

Dendrogram

Circular packing