Libraries and dataset
First we need to load the waffle and
dplyr libraries.
The input dataset contains groups and subgroups, with values of their size.
# library
library(waffle)
library(dplyr)

# Create data
data <- data.frame(
  group = c("First group", "First group", "First group", "First group",
            "First group", "First group", "Second group", "Second group",
            "Second group", "Second group", "Third group", "Third group"),
  subgroup = c("A", "B", "C", "D", "E", "F", "A", "B", "C", "D", "A", "B"),
  value = c(10, 20, 30, 40, 50, 60, 70, 80, 90, 100, 110, 120)
)
Grouped waffle chart
The geom_waffle() function can be used to build a waffle
chart with groups and subgroups. The fill argument is
used to color the chart by group.
ggplot(data = data, aes(fill=subgroup, values=value)) +
  geom_waffle(color = "white", size = 1.125, n_rows = 6) +
  facet_wrap(~group, ncol=1) +
  theme_void()

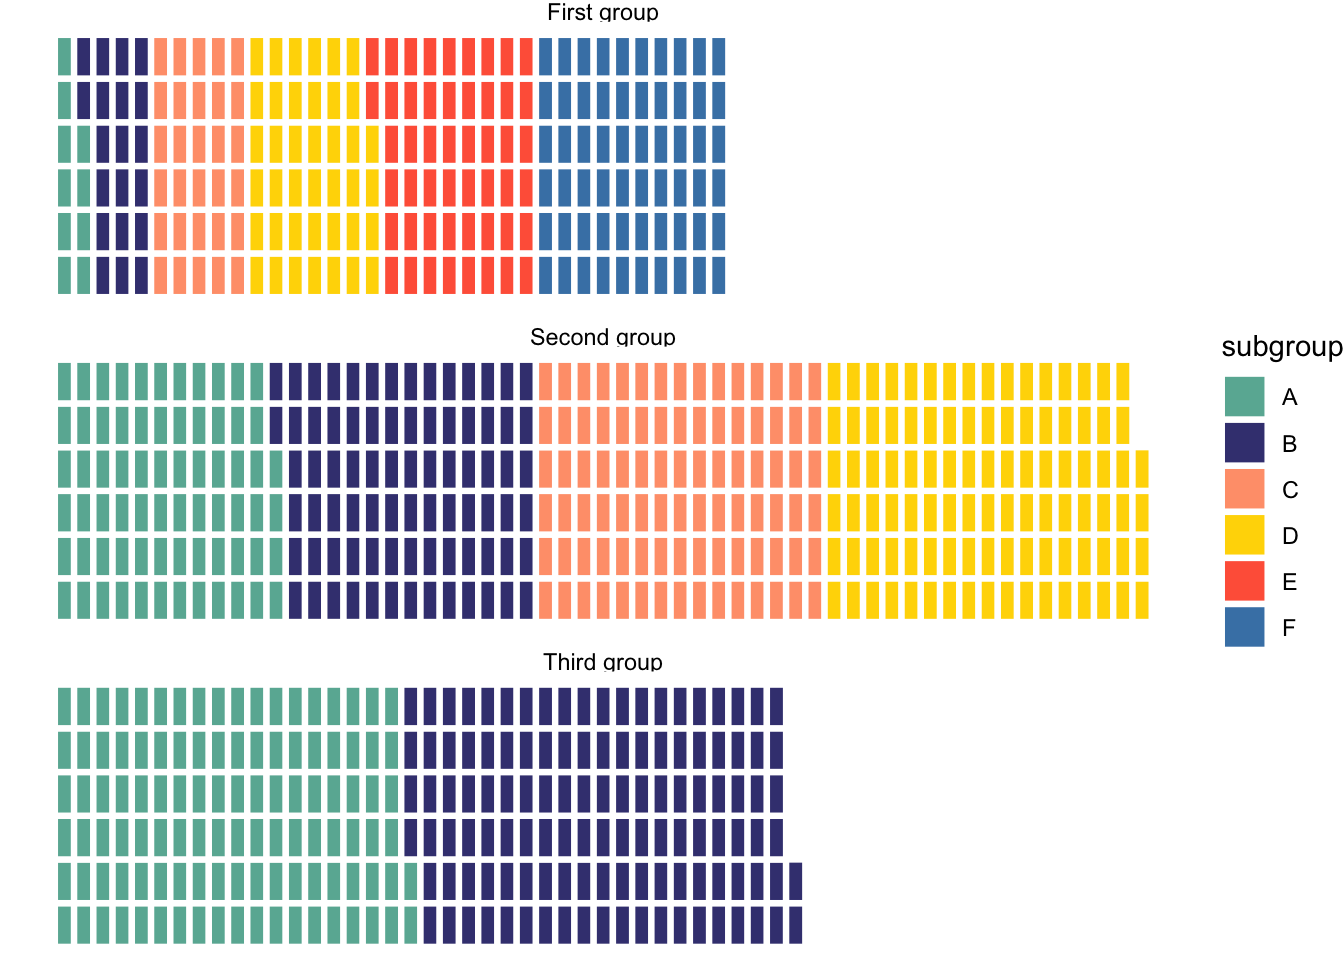
Custom colors
Thanks to the scale_fill_manual() function, it is
possible to customize the colors of the waffle chart:
ggplot(data = data, aes(fill=subgroup, values=value)) +
  geom_waffle(color = "white", size = 1.125, n_rows = 6) +
  facet_wrap(~group, ncol=1) +
  theme_void() +
  scale_fill_manual(values = c("#69b3a2", "#404080", "#FFA07A", "#FFD700", "#FF6347", "#4682B4"))
Going further
You might be interested in this introduction to geom_waffle() or more generally about waffle charts.