Custom Fonts in R Graphs with showtext
The showtext package in R is designed to make it easy
to use custom fonts in R graphics, including
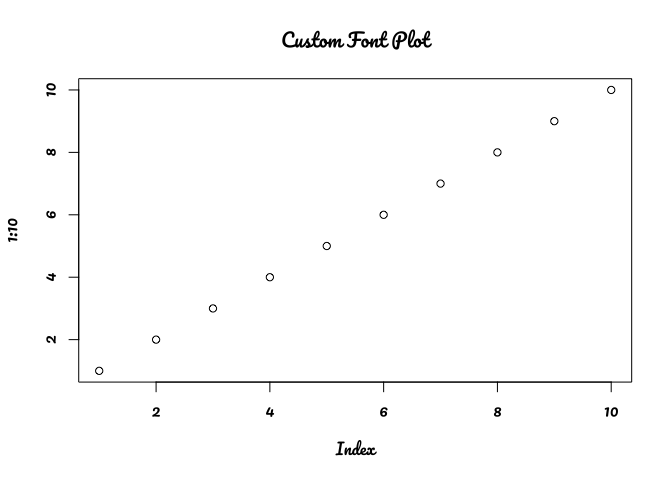
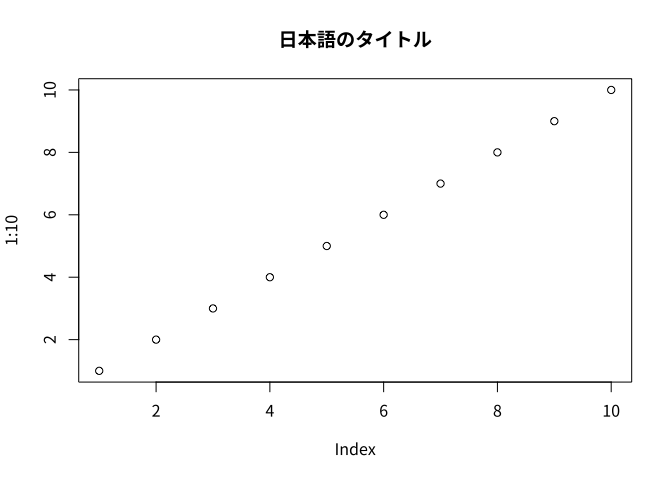
plots created with base R,
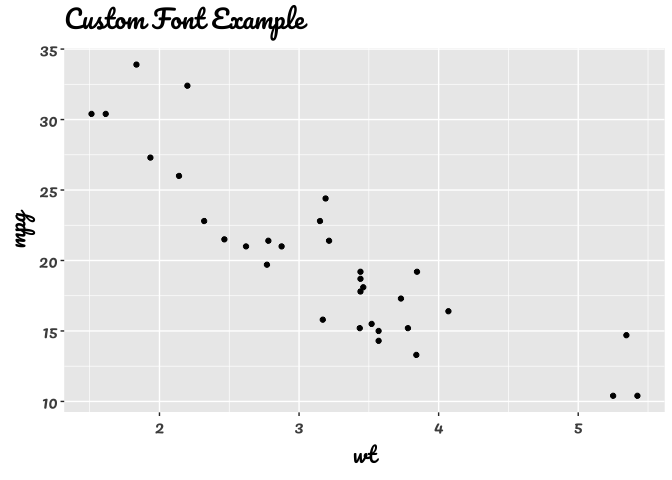
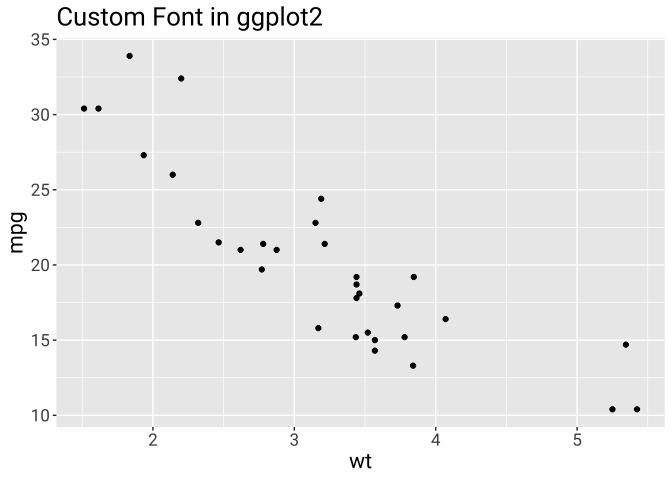
ggplot2, and other graphics systems.
This post showcases the
key features of showtext and
provides a set of graph examples using the
package.

{showtext}