Dataset
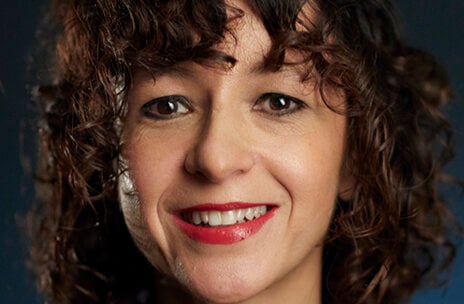
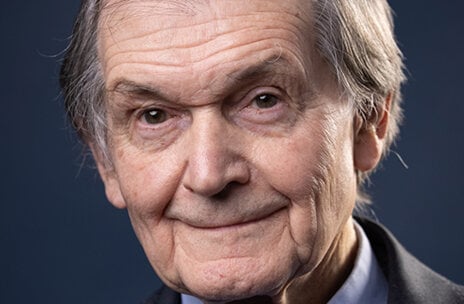
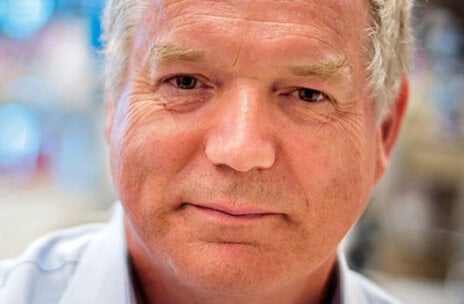
We create a simple dataset with Nobel Prizes (2020). We use 3 columns: name, field and image.
Add images
The kableExtra
relies on the kable package and allows the use of the
%>% (pipe) symbole. The main function is named
kbl() and is similar to kable().
In order to add images in column, we need to use the
column_spec() function with the image
argument. Also, to change dimensions of images, we use the
spec_image() function into the image arg.
# we use images from the internet, but it works exactly the same
# for images locally stored on your computer!
path_images = c("https://www.nobelprize.org/images/charpentier-111763-landscape-mini-2x.jpg",
                "https://www.nobelprize.org/images/penrose-111758-landscape-mini-2x.jpg",
                "https://www.nobelprize.org/images/gluck-111767-landscape-mini-2x.jpg",
                "https://www.nobelprize.org/images/houghton-111770-landscape-mini-2x.jpg")

df %>%
  kbl(booktabs = T, align = "c") %>%
  kable_styling() %>%
  kable_paper(full_width = T) %>%
  column_spec(3, image = spec_image(path_images, 280, 200) # dimensions of the images
)| name | field | image |
|---|---|---|
| E. Charpentier | Chemistry |

|
| R. Penrose | Physics |

|
| L. Glück | Litterature |

|
| M. Houghton | Medicine |

|
Add links
The row_spec() and column_spec() functions
have a color and background arguments that
will change the colors, either of the background or the
cell content.
urls = c("https://en.wikipedia.org/wiki/Emmanuelle_Charpentier",
         "https://en.wikipedia.org/wiki/Roger_Penrose",
         "https://en.wikipedia.org/wiki/Louise_Glück",
         "https://en.wikipedia.org/wiki/Michael_Houghton")

df %>%
  kbl(booktabs = T, align = "c") %>%
  kable_styling() %>%
  kable_paper(full_width = T) %>%
column_spec(1, link = urls)| name | field | image |
|---|---|---|
| E. Charpentier | Chemistry | |
| R. Penrose | Physics | |
| L. Glück | Litterature | |
| M. Houghton | Medicine |
Combine images and links
The color and background argument can also
takes a vector of colors:
path_images = c("https://www.nobelprize.org/images/charpentier-111763-landscape-mini-2x.jpg",
                "https://www.nobelprize.org/images/penrose-111758-landscape-mini-2x.jpg",
                "https://www.nobelprize.org/images/gluck-111767-landscape-mini-2x.jpg",
                "https://www.nobelprize.org/images/houghton-111770-landscape-mini-2x.jpg")

urls = c("https://en.wikipedia.org/wiki/Emmanuelle_Charpentier",
         "https://en.wikipedia.org/wiki/Roger_Penrose",
         "https://en.wikipedia.org/wiki/Louise_Glück",
         "https://en.wikipedia.org/wiki/Michael_Houghton")

df %>%
  kbl(booktabs = T, align = "c") %>%
  kable_styling() %>%
  kable_material(c("striped", "hover", "condensed", "responsive")) %>%
  column_spec(1, link = urls, bold=TRUE) %>%
  column_spec(1, link = urls, bold=TRUE) %>%
column_spec(3, image = spec_image(path_images, 280, 200))| name | field | image |
|---|---|---|
| E. Charpentier | Chemistry |

|
| R. Penrose | Physics |

|
| L. Glück | Litterature |

|
| M. Houghton | Medicine |

|
Conclusion
This post explained how to add images and links in a table using the kableExtra library. For more of this package, see the dedicated section or the table section.
❤️ 10 best R tricks ❤️
👋 After crafting hundreds of R charts over 12 years, I've distilled my top 10 tips and tricks. Receive them via email! One insight per day for the next 10 days! 🔥


