Libraries and dataset
The waffle package provides a
waffle() function that allows to build waffle charts.
Install the package with
install.packages("waffle").
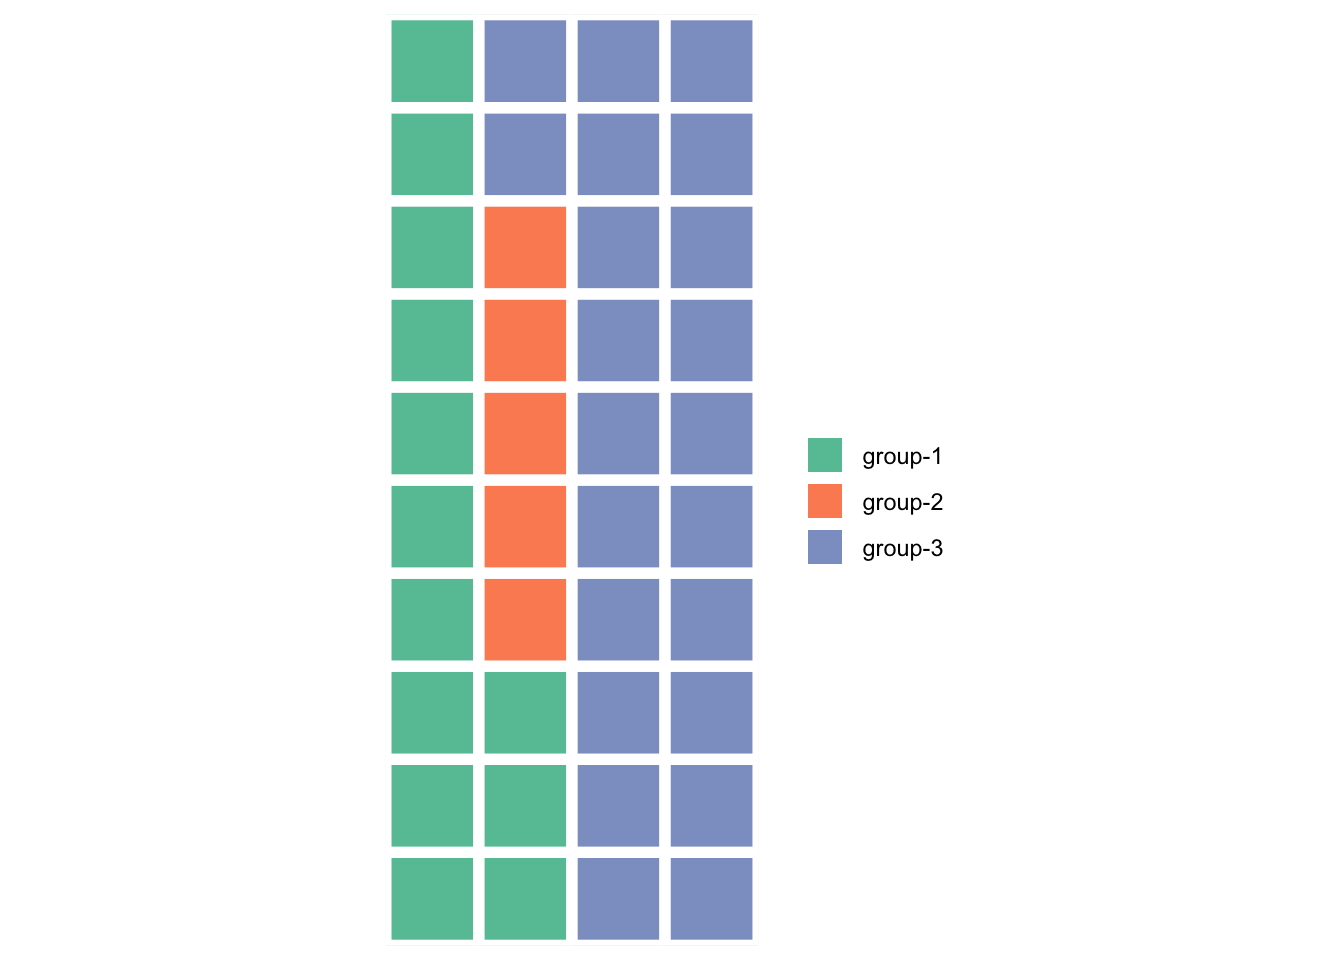
The input dataset is simple: we just have 3 groups, and each one has a value.
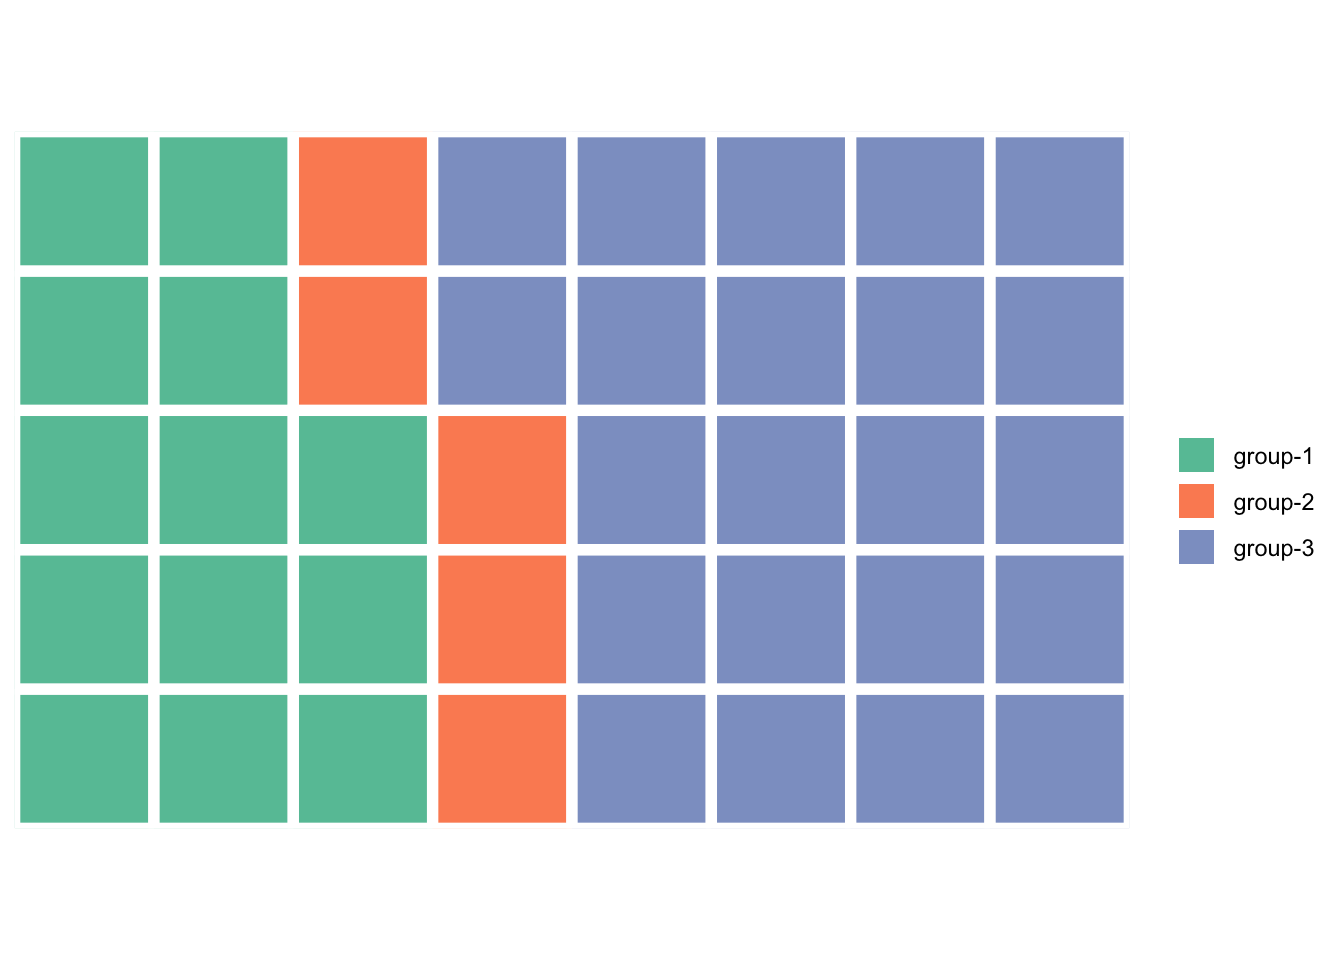
Change output
The default output will have 10 rows, but you can change this with the
rows argument:
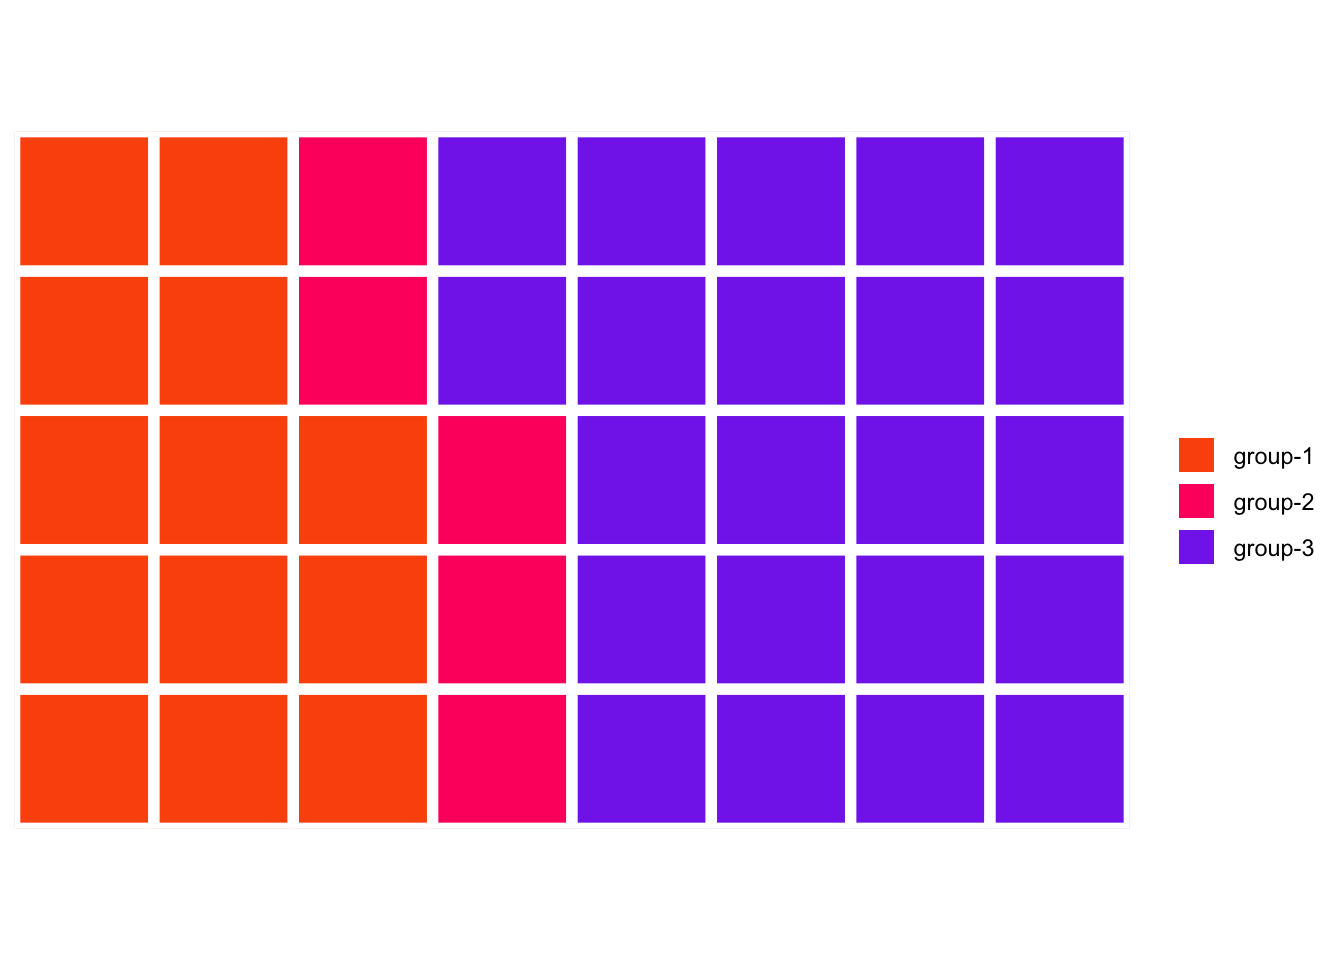
Colors
You can change the color of the waffle chart with the
colors argument. Here is an example with 3 colors:
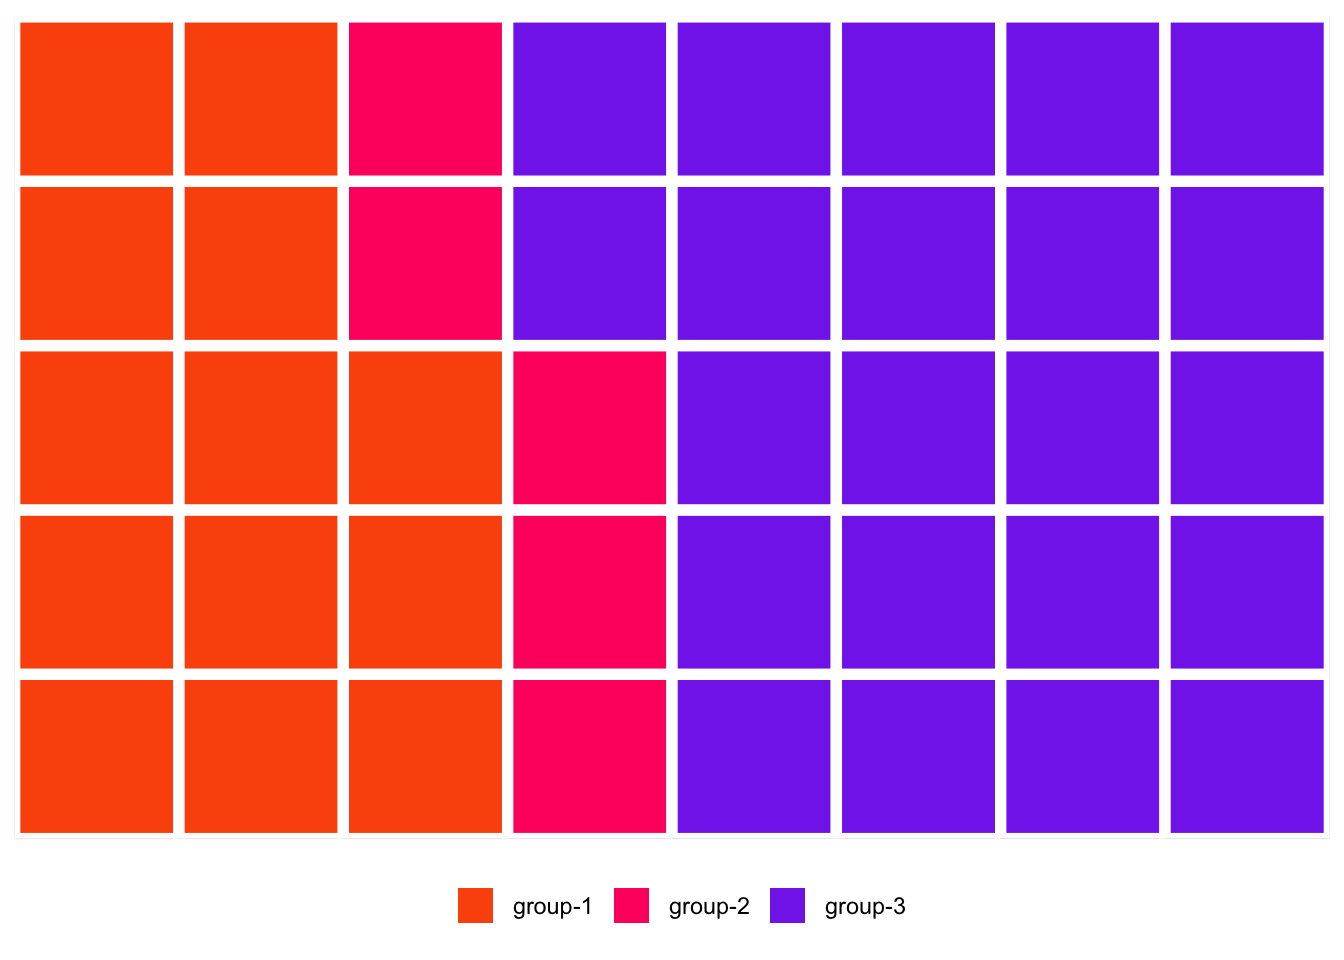
Legend position
You can change the position of the legend with the
legend_pos argument. Here is an example with the legend
on the bottom:
Going further
You might be interested in creating waffle charts with ggplot and waffle charts with subgroups.