Data visualization with base R


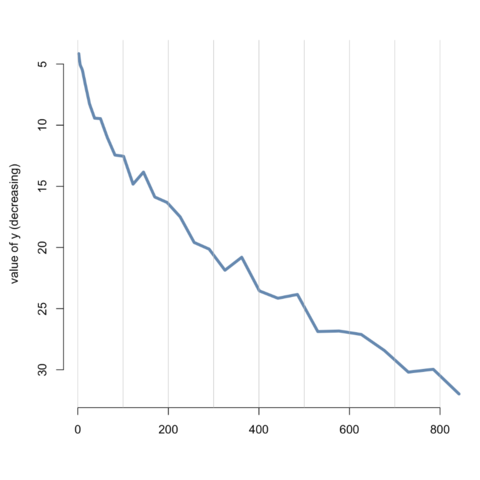
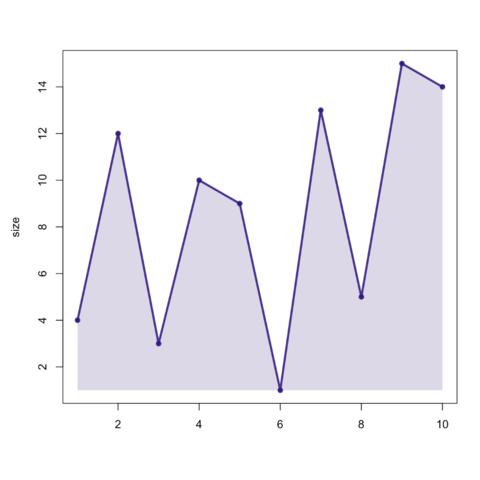
R did not wait for ggplot2 to offer awesome data visualization features. It allows to build absolutely any type of chart, as described in this section and in the gallery.

However, it often requires additional quantity of code, but
some people will argue that it allows a greater flexibility.

This section is dedicated to tips and tricks applying to any base R chart. If you're interested in a specific chart type, browse the gallery as all chart section offer base R option.
Last but not least, this course can be great to improve your R data analysis skills in general.
Shape parameters

Main shape features can be controled with a few parameters I always forget.

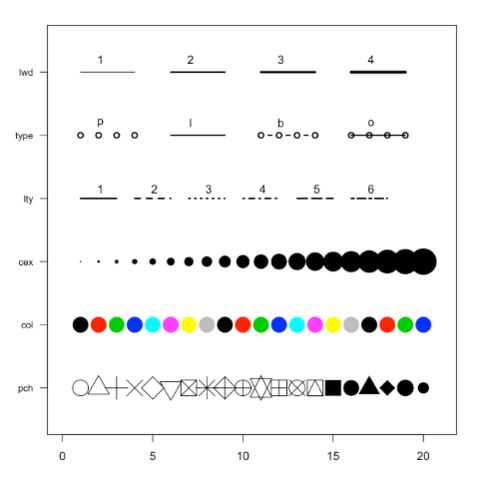
For lines, the lwd, type and lty parameters allow to control everything. For markers, cex, col and pch do the trick.

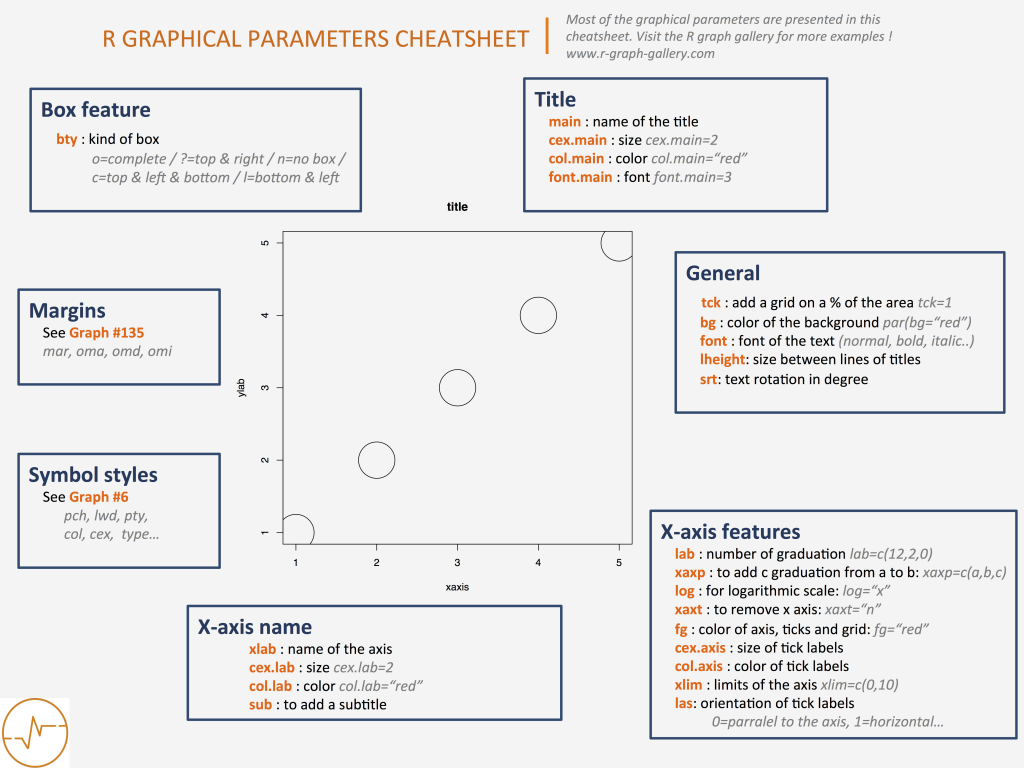
Here is a cheatsheet I often come back on to refresh my mind.


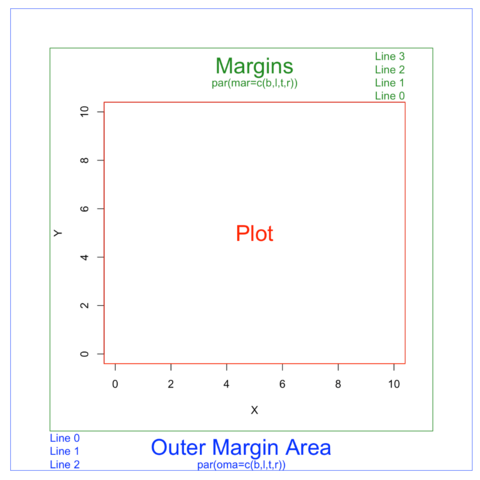
Dealing with margins: mar and oma

Two types of margin are available on a base R chart, controled by the par and the oma parameters.

They are both called through the par() function as described in the dedicated post.


Other chart parameters: a cheatsheet

Here is a cheatsheet summarizing the most common base R option to customize the chart appearance.


An overview of base R possibilities

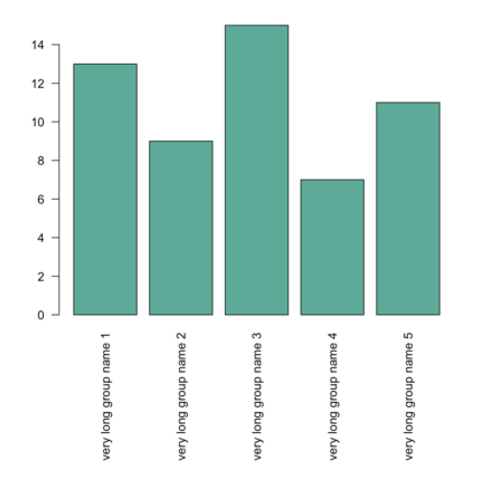
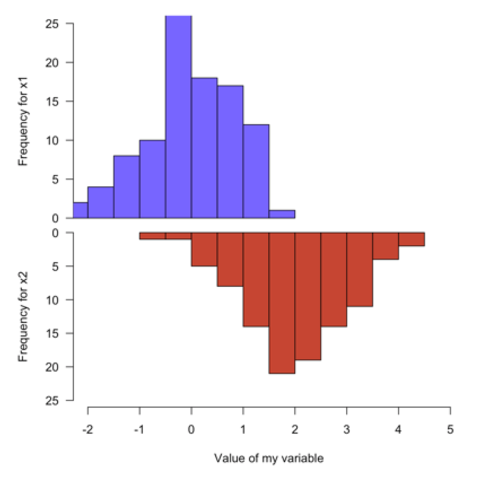
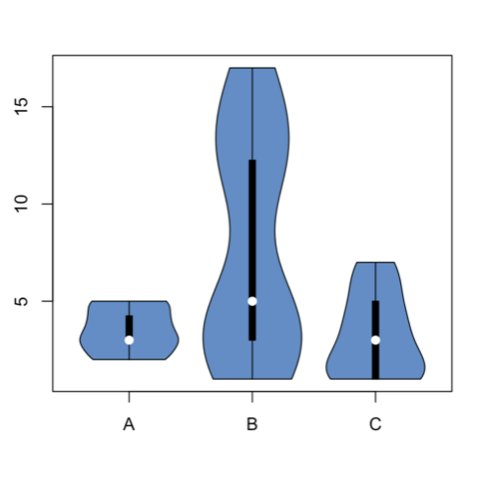
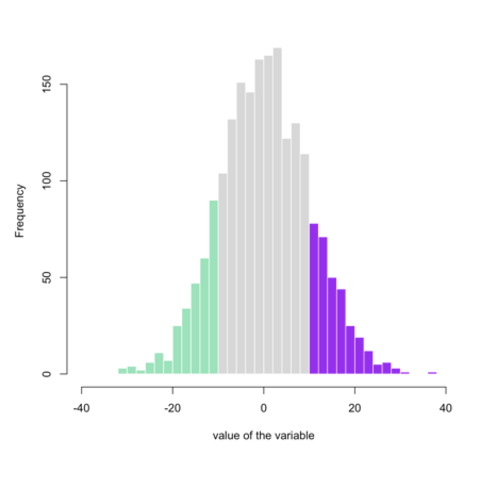
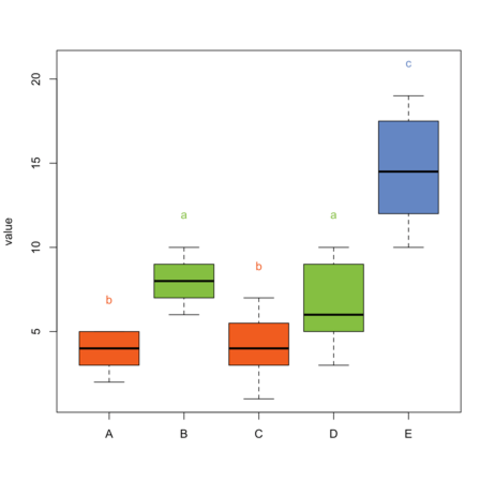
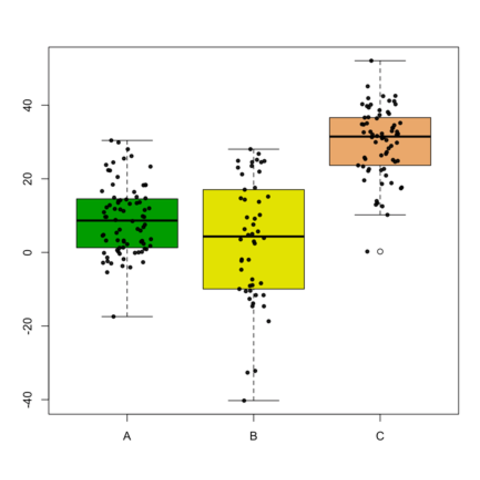
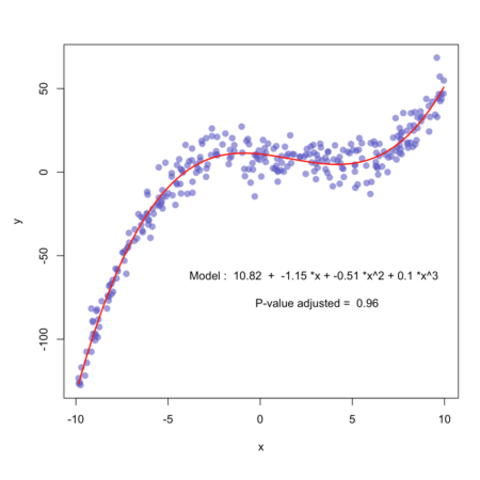
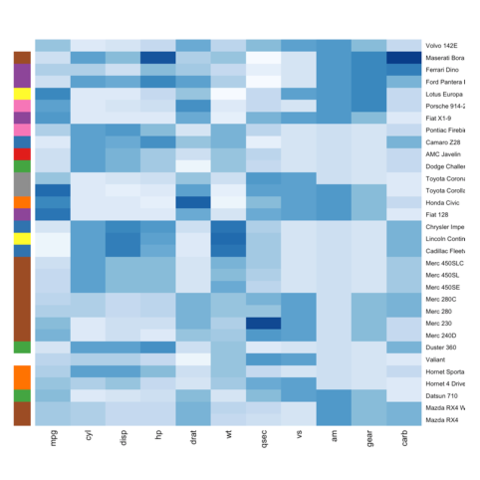
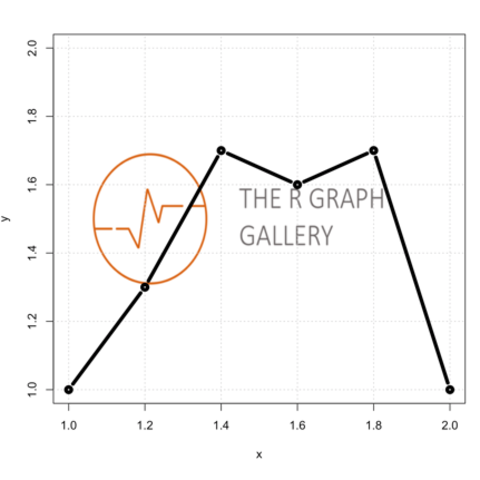
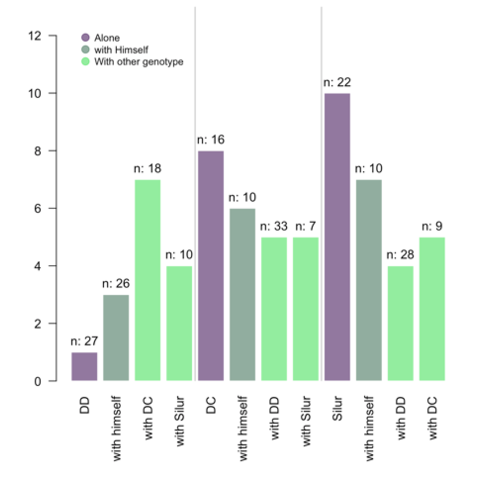
Each section of the gallery provides several examples implemented with base R. Here is an overview of my favorite examples:

Related chart types


Chord diagram
Network
Sankey
Arc diagram
Edge bundling