Hexbin map


A hexbin map refers to two different concepts. It can be based on a geospatial object where all regions of the map are represented as hexagons. Or it can refer to a 2d density technique described in this section. This section of the gallery provides several examples with step by step explanations.

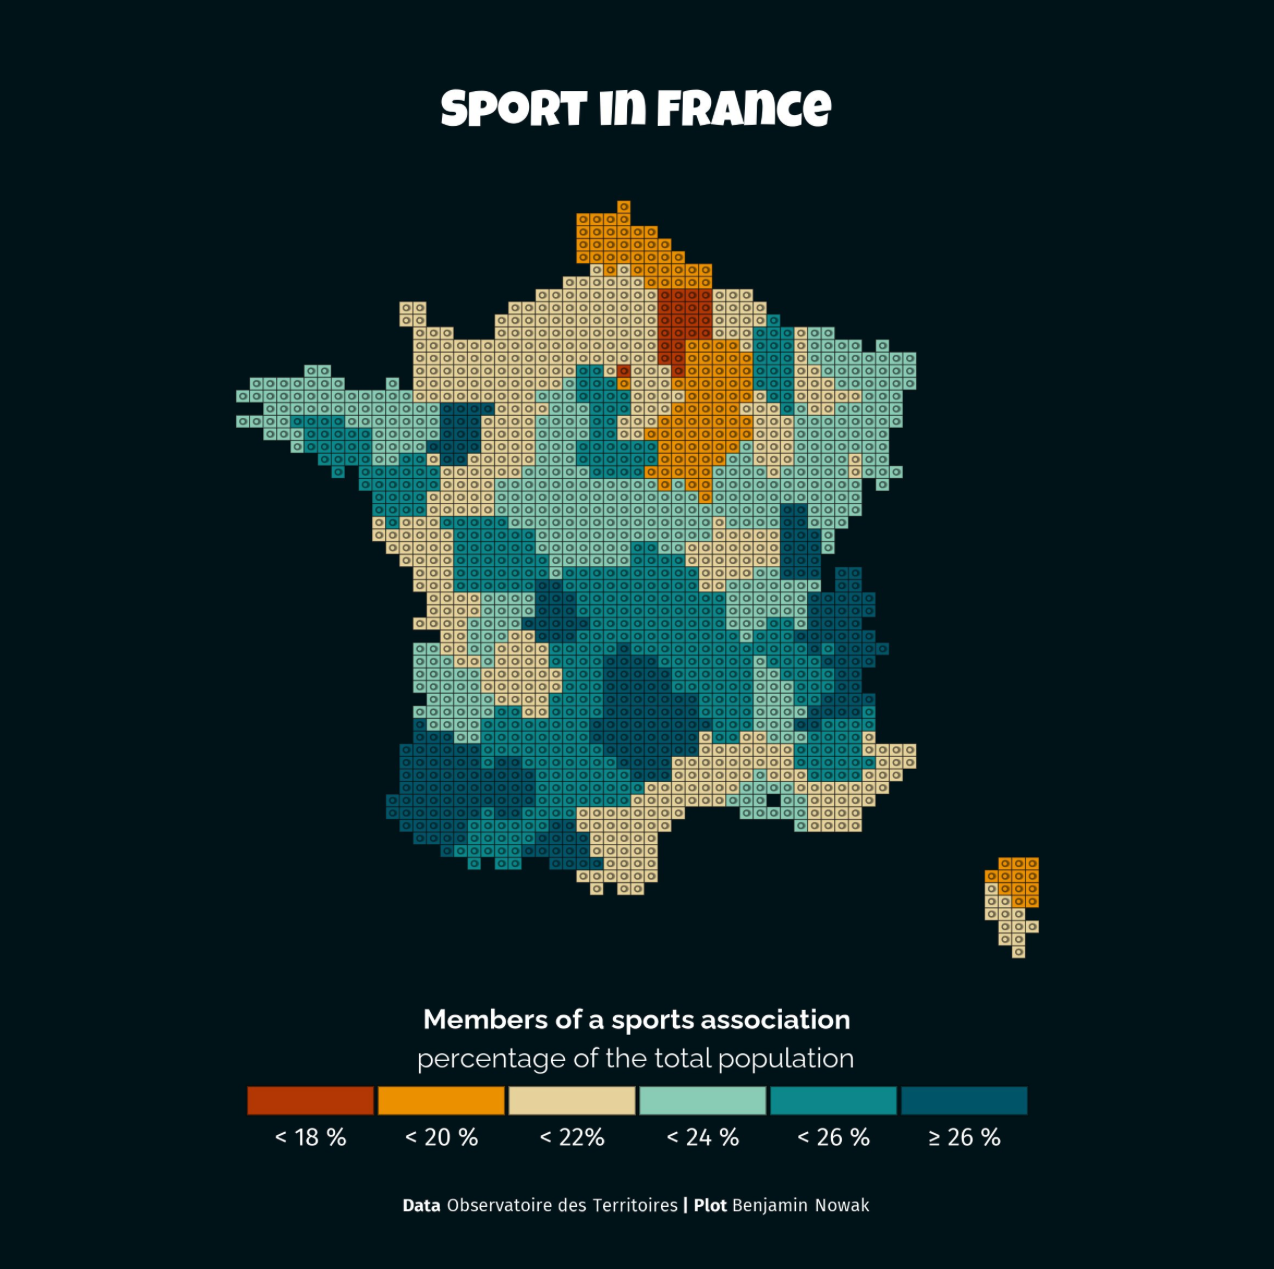
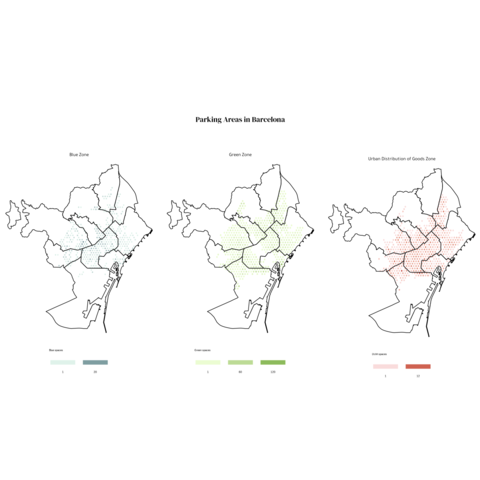
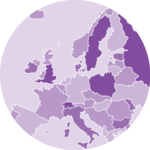
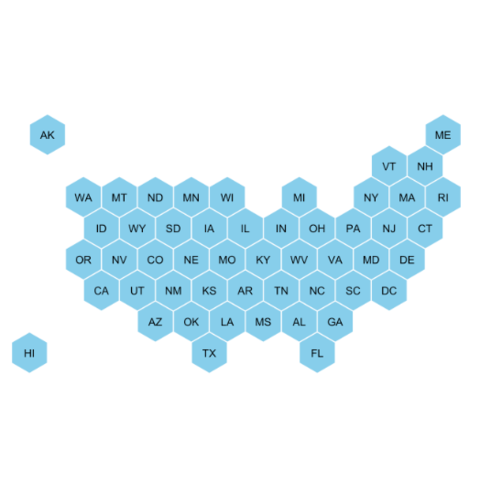
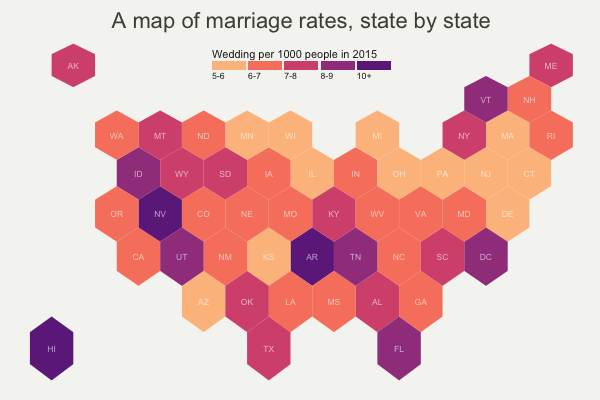
Hexbin map from geospatial object

In this case, the technique is very close from a choropleth map. It's actually exactly the same, except that the geoJson input gives hexagon boundaries instead of region boundaries. Thus, you probably want to visit the choropleth section for more examples.

Choropleth section


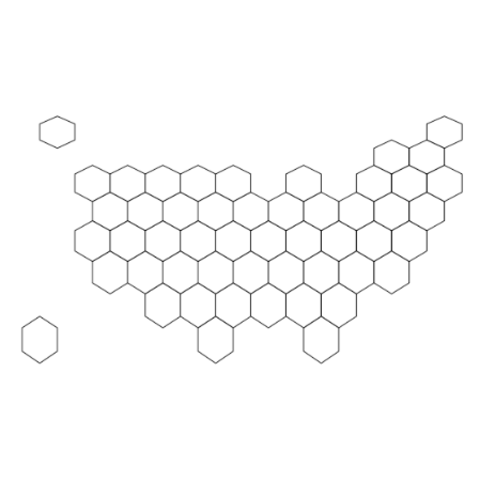
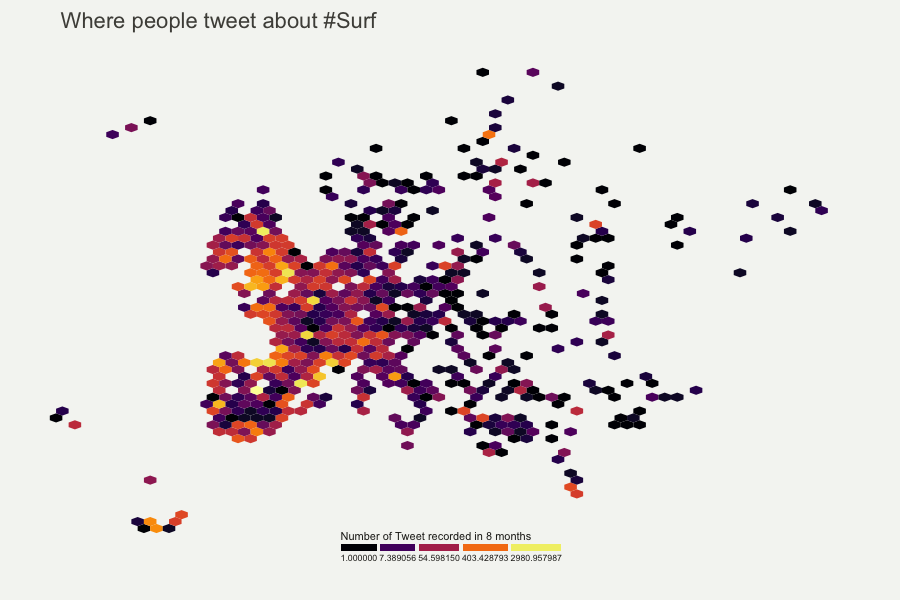
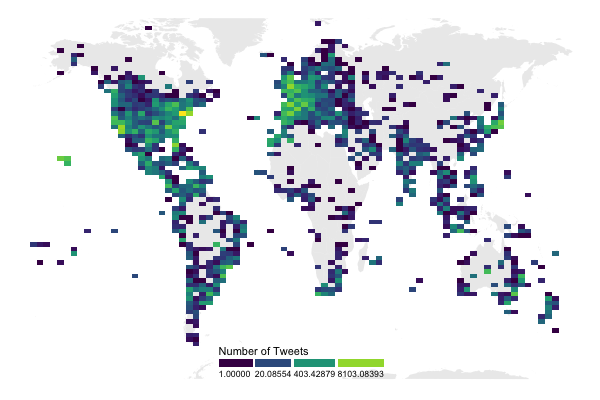
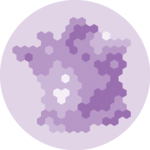
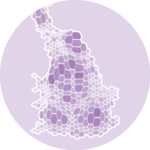
Hexbin map from list of coordinates

In this case, the required input is a list of coordinates. The map area is split in a multitude of hexagons with geom_hex() (or squares with geom_bin2d()), the number of data point per hexagon is counted and represented as a color. It is actually a density 2d technique plotted on top of a map.

Density 2d section

Best R Hexbin Maps

The web is full of astonishing R charts made by awesome bloggers. The R graph gallery tries to display some of the best creations and explain how their source code works. If you want to display your work here, please drop me a word or even better, submit a Pull Request!

Related chart types


Map
Choropleth
Hexbin map
Cartogram
Connection
Bubble map