The Largest Collection of R Chart Examples
The R Graph Gallery boasts the most extensive compilation of R-generated graphs on the web.
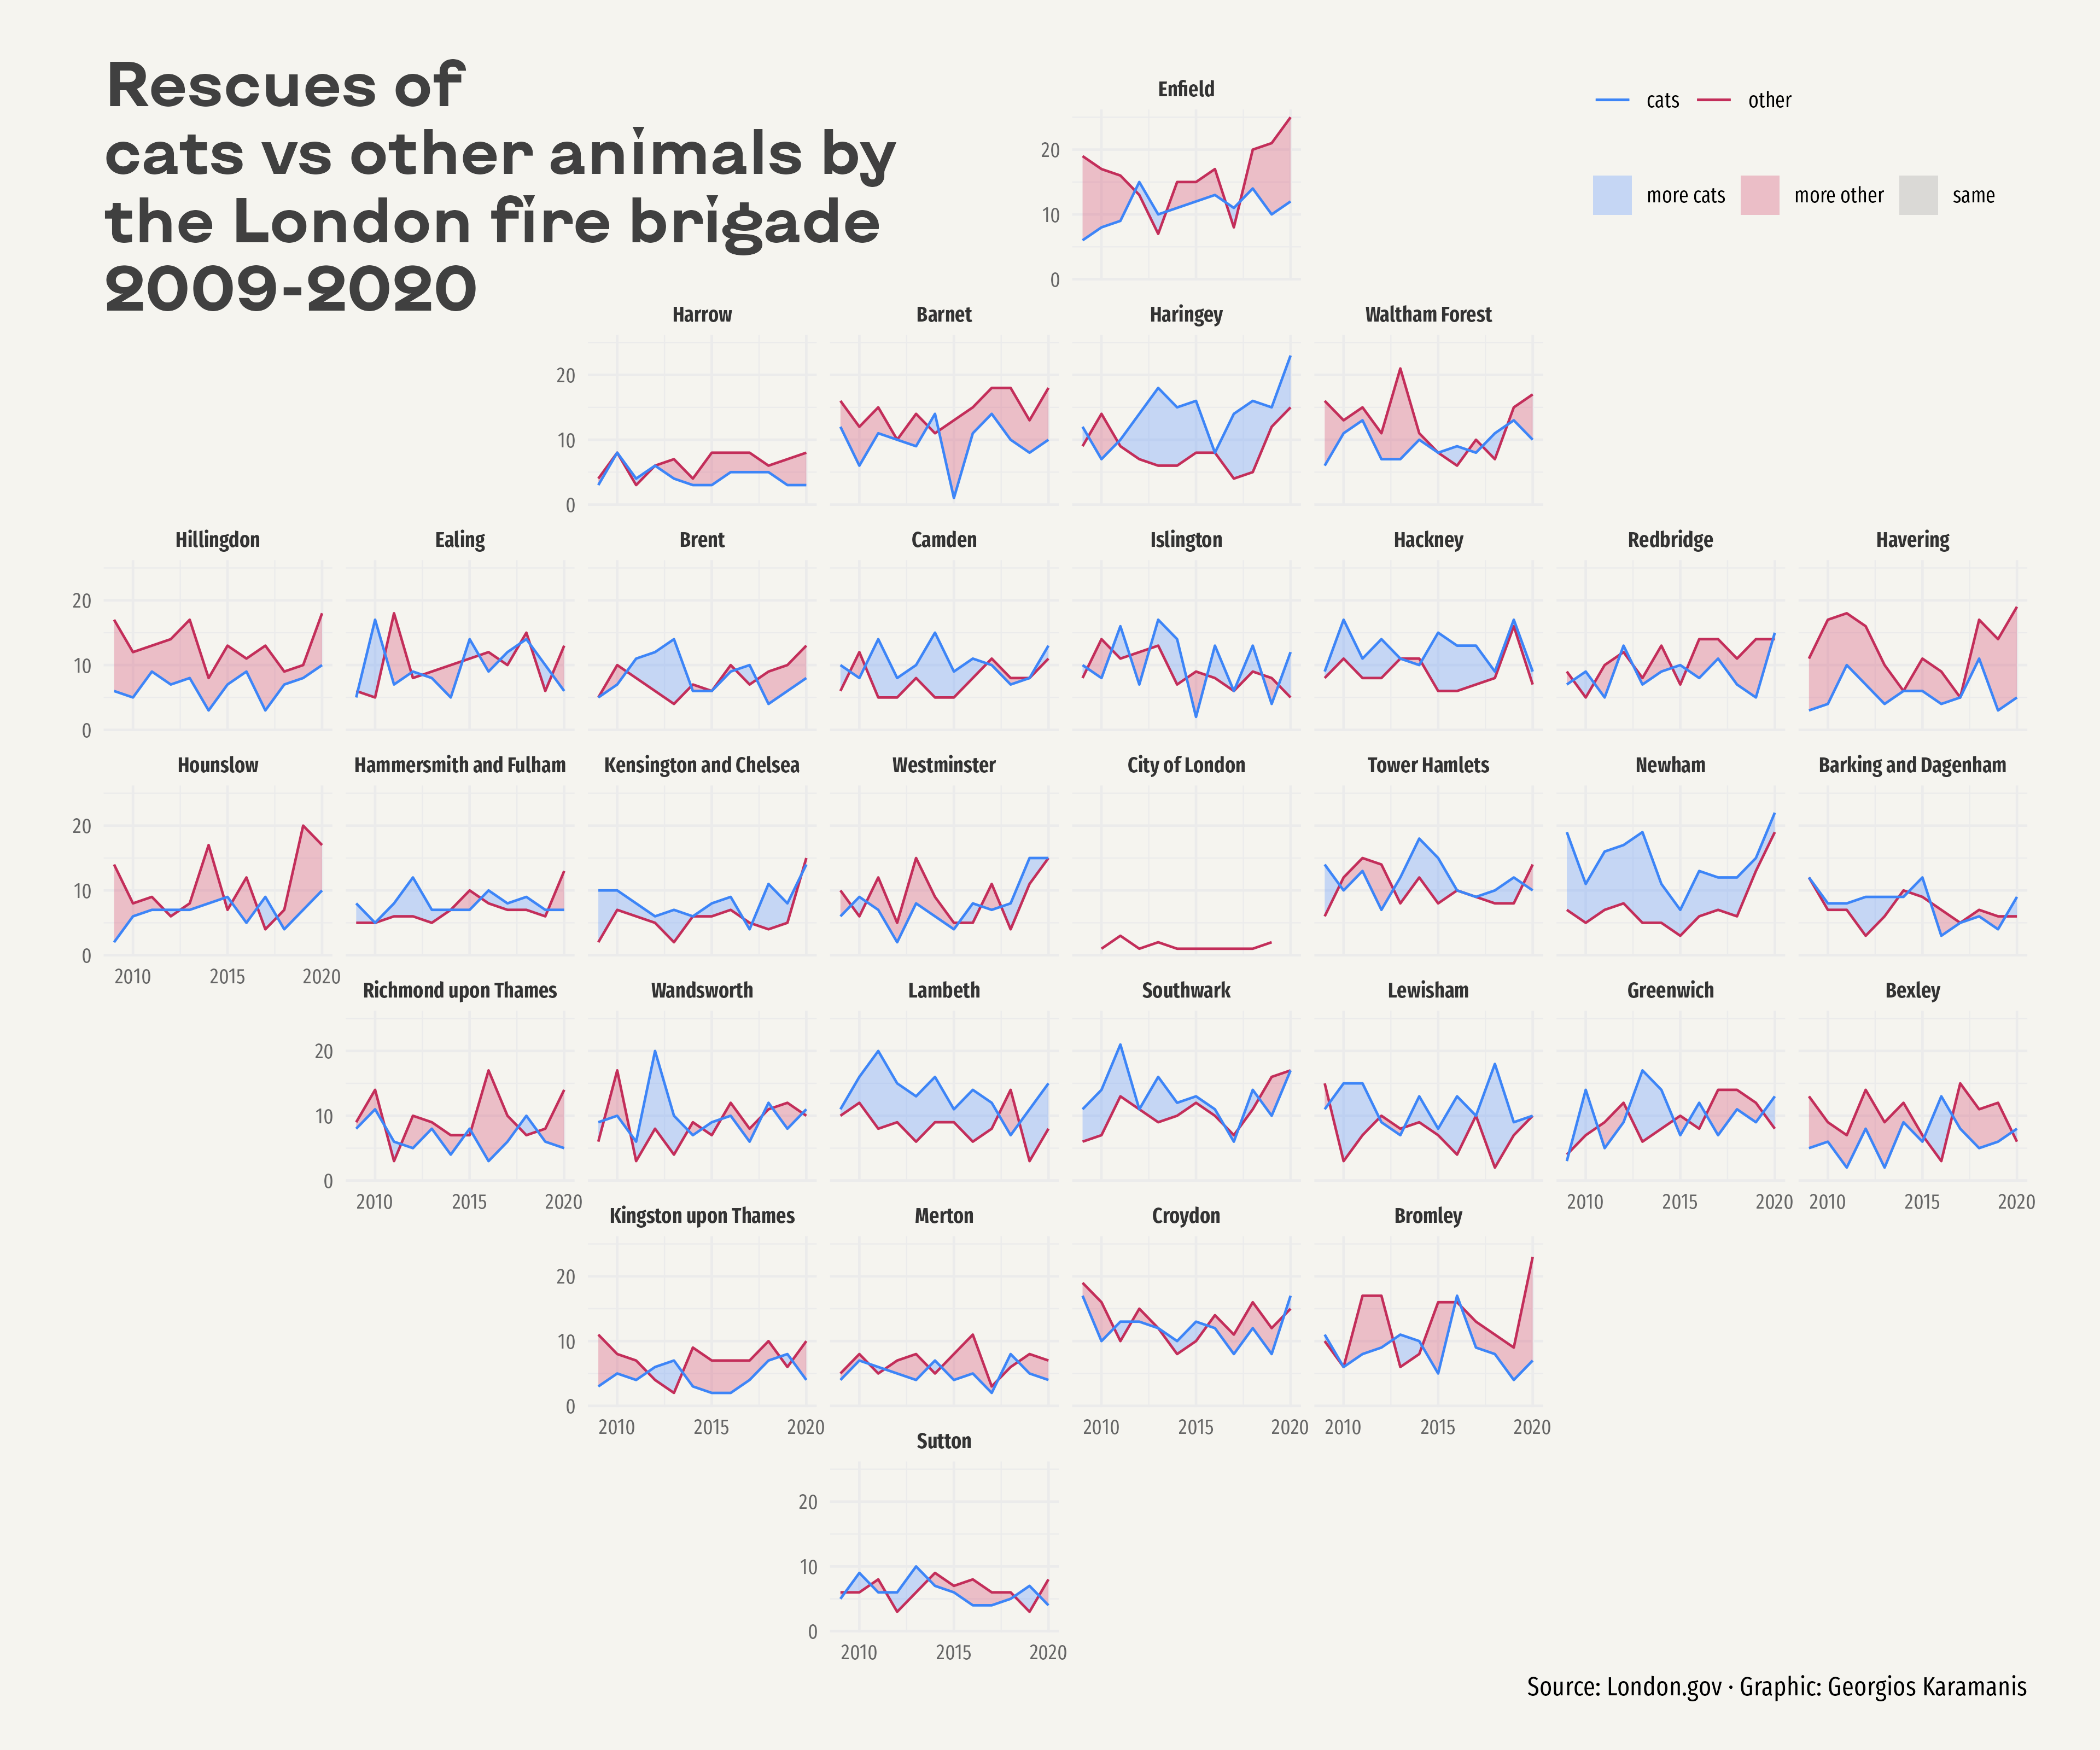
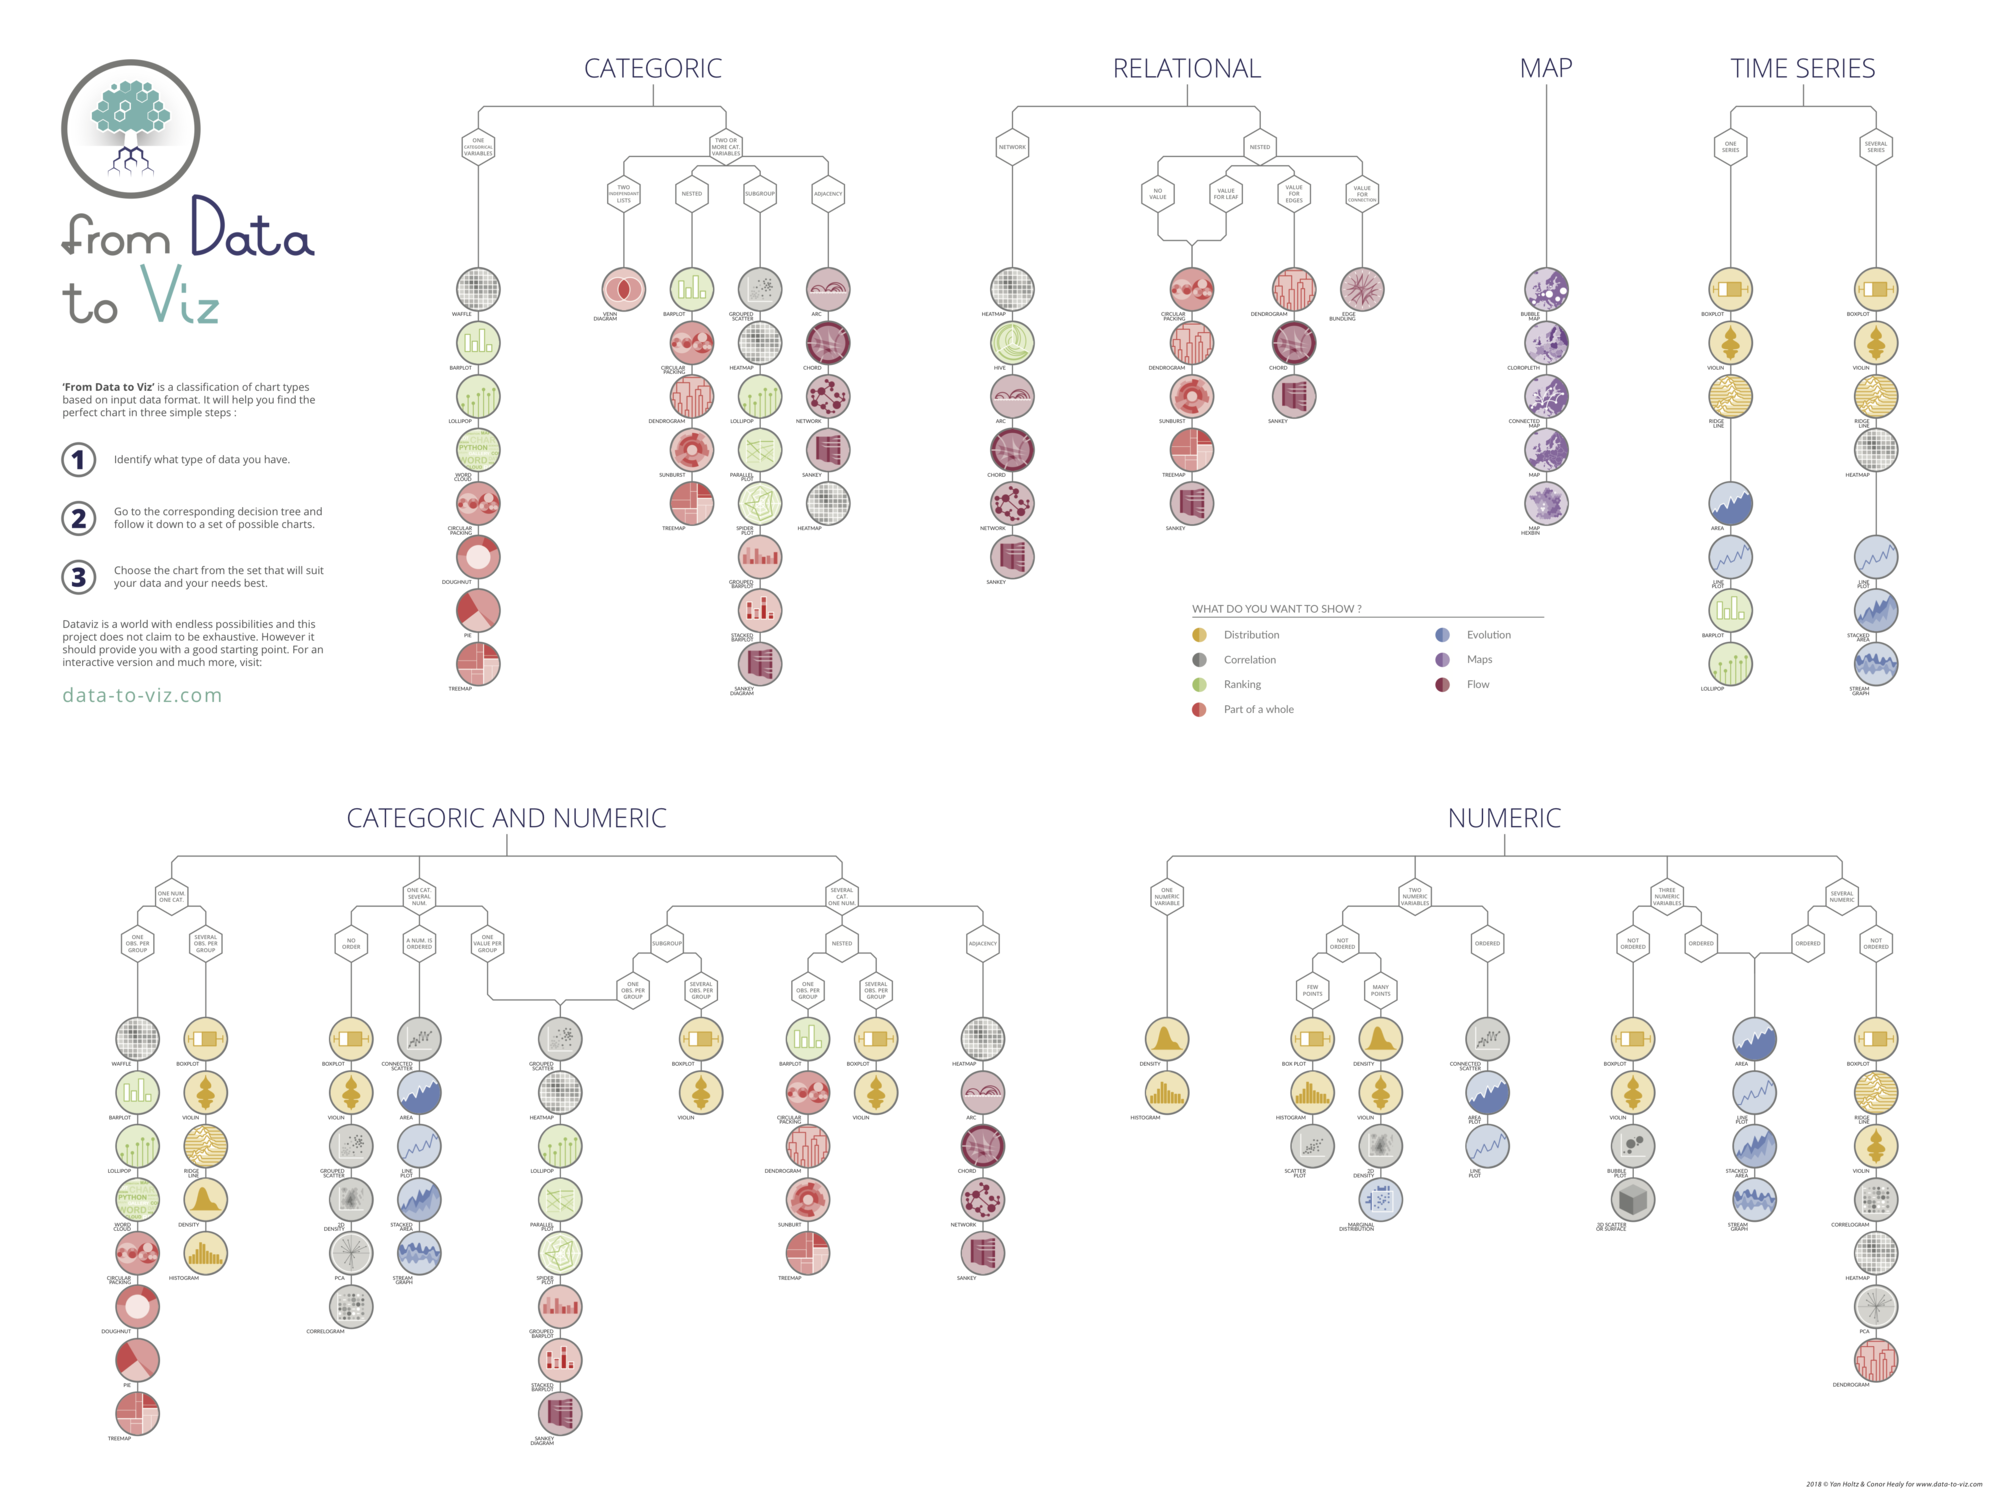
Featuring over 400 examples, our collection is meticulously organized into nearly 50 chart types, following the data-to-viz classification. Each example comes with reproducible code and a detailed explanation of its functionality.
We begin each chart type with a foundational tutorial that outlines its core structure and purpose. Once you've grasped the basics, our step-by-step guides offer insights into elementary customizations. This ensures that your charts not only visualize data effectively but also resonate with your unique requirements.
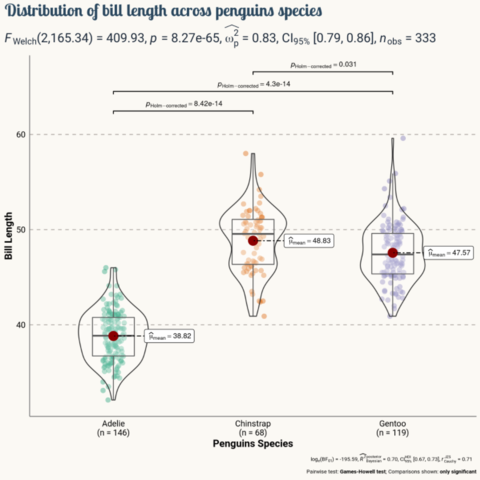
Distribution


Correlation


Ranking


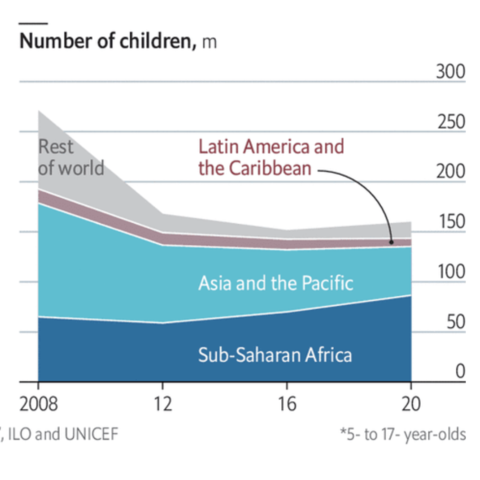
Part of a whole


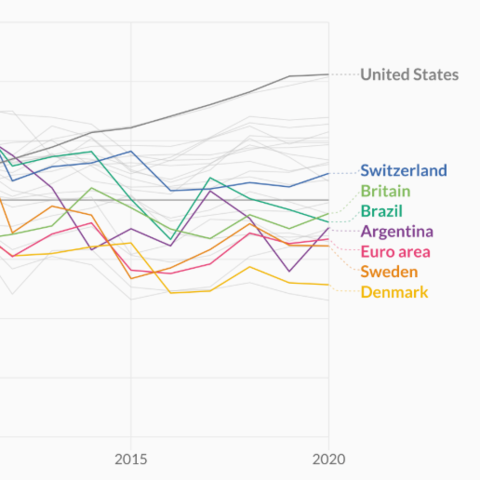
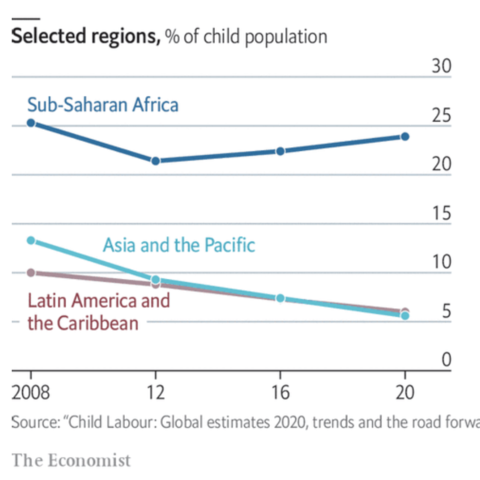
Evolution


Map


Flow


General knowledge


Best packages